. 2012;7(5):e37150.
doi: 10.1371/journal.pone.0037150. Epub 2012 May 21.

Circadian desynchrony promotes metabolic disruption in a mouse model of shiftwork

Affiliations

Circadian desynchrony promotes metabolic disruption in a mouse model of shiftwork

Johanna L Barclay et al. PLoS One. 2012.

Abstract

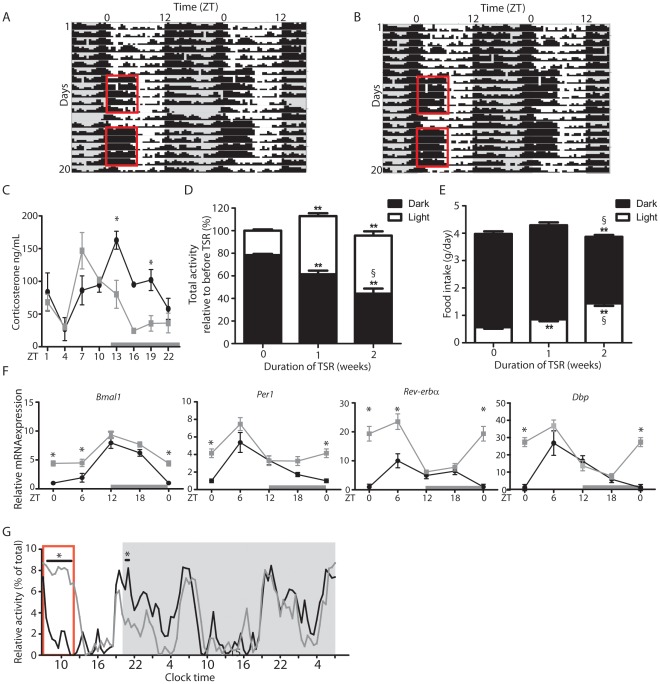
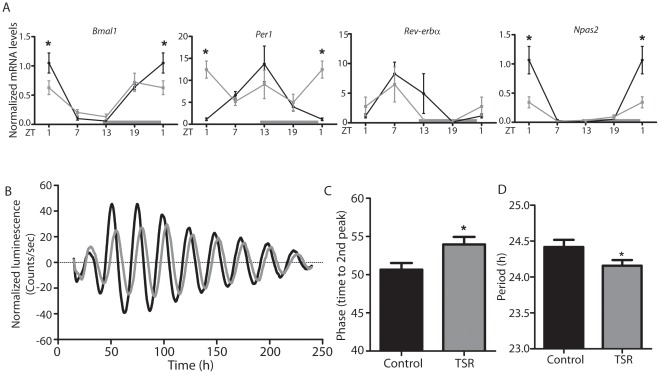
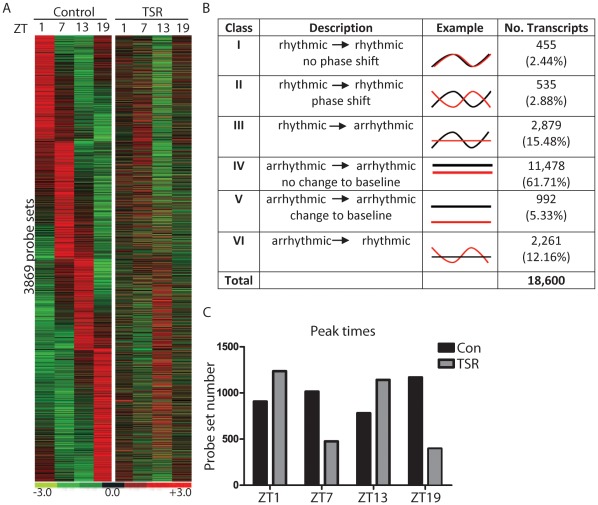
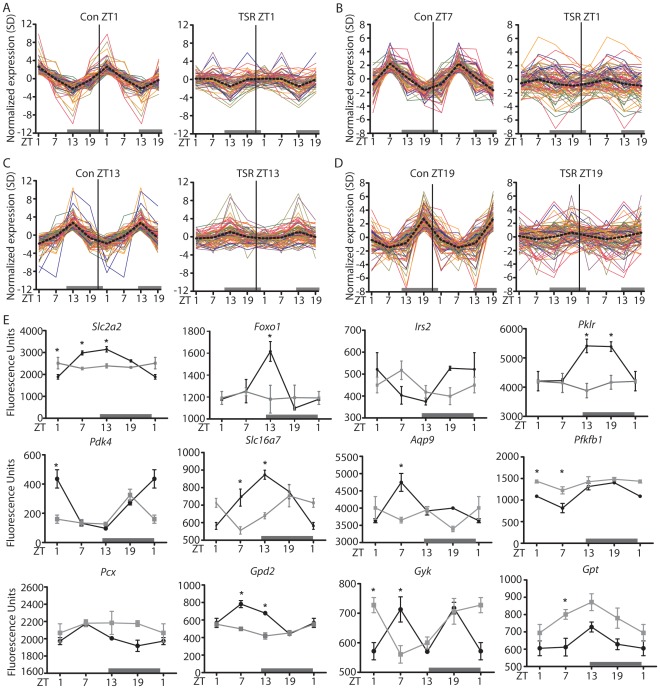
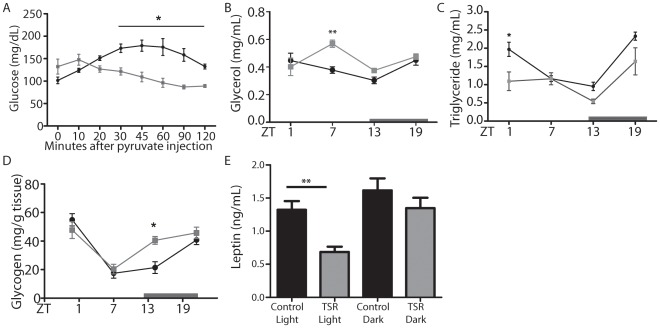
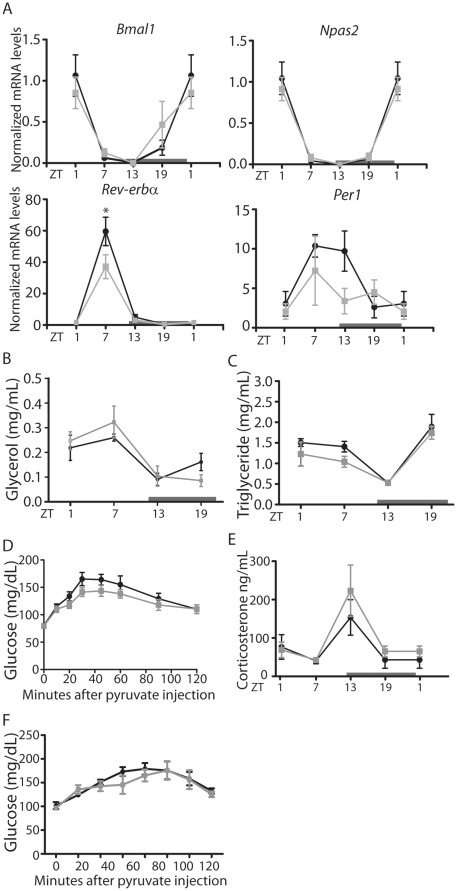
Shiftwork is associated with adverse metabolic pathophysiology, and the rising incidence of shiftwork in modern societies is thought to contribute to the worldwide increase in obesity and metabolic syndrome. The underlying mechanisms are largely unknown, but may involve direct physiological effects of nocturnal light exposure, or indirect consequences of perturbed endogenous circadian clocks. This study employs a two-week paradigm in mice to model the early molecular and physiological effects of shiftwork. Two weeks of timed sleep restriction has moderate effects on diurnal activity patterns, feeding behavior, and clock gene regulation in the circadian pacemaker of the suprachiasmatic nucleus. In contrast, microarray analyses reveal global disruption of diurnal liver transcriptome rhythms, enriched for pathways involved in glucose and lipid metabolism and correlating with first indications of altered metabolism. Although altered food timing itself is not sufficient to provoke these effects, stabilizing peripheral clocks by timed food access can restore molecular rhythms and metabolic function under sleep restriction conditions. This study suggests that peripheral circadian desynchrony marks an early event in the metabolic disruption associated with chronic shiftwork. Thus, strengthening the peripheral circadian system by minimizing food intake during night shifts may counteract the adverse physiological consequences frequently observed in human shift workers.


Conflict of interest statement

Competing Interests: The authors have declared that no competing interests exist.

Figures

Figure 1
Figure 1. TSR results in perturbations of diurnal behavioral rhythms.
(A and B) Representative activity recordings of TSR mice. Actograms are double-plotted. Grey shadings indicate dark phases, red boxes indicate period of TSR. (C) Plasma corticosterone in control and TSR mice on Day12 of TSR (n = 3−5). (D) Distribution of light and dark activity during TSR expressed as % of total activity of the same set of animals during control conditions (n = 5 cages of 4 mice each), * indicates p<0.05 and **p<0.01 relative to 0 weeks of TSR, § indicates p<0.05 relative to 1 week of TSR. (E) Food intake during light and dark phase during TSR, * indicates p<0.05 and **p<0.01 relative to 0 weeks of TSR (n = 10−23), § indicates p<0.05 relative to 1 week of TSR determined by 2-way ANOVA. (F) Quantitation of clock gene mRNA by ISH in the SCN of control and TSR mice expressed relative to controls at ZT0 (n = 3 at each time point). (G) Activity of control and TSR mice upon release into DD (n = 3 cages). Grey bars indicate dark phase, red box indicates last period of gentle handling. Control mice represented by black lines, TSR mice by grey lines; * indicates p<0.05 determined by 2-way ANOVA.
Figure 2
Figure 2. TSR resets the hepatic circadian clock.
(A) qPCR analysis of diurnal clock gene mRNA profiles in the liver of control and TSR mice (n = 3 at each time point). (B) Luciferase activity in liver slice cultures from control and TSR PER2::LUC mice (n = 8) and (C) quantitation of phase and (D) period. Control mice are represented by black lines, TSR mice by grey lines; * indicates p<0.05 determined by 2-way ANOVA.
Figure 3
Figure 3. TSR causes global disruption of transcriptome rhythmicity in the liver.
(A) Heat map illustrating diurnal expression of rhythmically expressed genes sorted for phase in control animals, and their corresponding expression profiles in TSR animals in liver (n = 3 at each time point). (B) Summary of transcriptional effects seen in liver following TSR. (C) Peak times of rhythmically expressed genes under control and TSR conditions. Black bars and lines indicate controls, grey bars and red lines indicate TSR.
Figure 4
Figure 4. Metabolic gene rhythmicity in the liver is affected by shiftwork.
Double plotted expression profiles of rhythmic genes associated with the GO terms ‘Carbohydrate Metabolism’, ‘Lipid Metabolism’ and ‘Amino Acid Metabolism’ sorted for peak time ((A) ZT1, (B) ZT7, (C) ZT13 and (D) ZT19) for both control and TSR groups. (E) Array expression profiles of selected metabolically relevant genes with altered expression profiles in the livers of TSR mice. Control mice are represented by black lines, TSR mice by grey lines; * indicates p<0.05 determined by 2-way ANOVA.
Figure 5
Figure 5. Metabolic effects of TSR.
(A) Pyruvate tolerance test in control and TSR mice (n = 5). Circulating glycerol (B) and triglyceride (C) rhythms in control and TRS mice (n = 3 at each time point). (D) Liver glycogen levels in control and TSR mice (n = 3 at each time point) (E) Leptin levels during light and dark phase in control and TRS mice (n = 10). Control mice are represented by black lines, TSR mice by grey lines; * indicates p<0.05 and **p<0.01 determined by 2-way ANOVA.
Figure 6
Figure 6. Dark phase feeding rescues TSR-induced disruption of peripheral clock gene expression and gluconeogenesis.
(A) qPCR analysis of clock gene expression in the liver of control/dark phase fed (DF) and TSR/dark phase fed (DF-TSR) mice. (B) Plasma glycerol and (C) triglyceride rhythms in control/DF and DF-TSR mice. (D) Pyruvate tolerance test in control/DF and DF-TSR mice (n = 5). (E) Plasma corticosterone control/DF fed and DF-TSR mice. (F) Pyruvate tolerance test in non-TRS mice under a TSR-like feeding regimen (n = 5). (A-E) Control mice are represented by black lines, TSR mice by grey lines. (F) Ad libitum fed mice are represented by black lines, TSR-like fed mice are represented by grey lines; * indicates p<0.05 determined by 2-way ANOVA, n = 3 at each time point, unless stated otherwise.

References

    1. Baron KG, Reid KJ, Kern AS, Zee PC. Role of Sleep Timing in Caloric Intake and BMI. Obesity. 2011;19:1374–1381. - PubMed
    1. Karlsson B, Knutsson A, Lindahl B. Is there an association between shift work and having a metabolic syndrome? Results from a population based study of 27,485 people. Occup Environ Med. 2001;58:747–752. - PMC - PubMed
    1. Fonken LK, Workman JL, Walton JC, Weil ZM, Morris JS, et al. Light at night increases body mass by shifting the time of food intake. Proceedings of the National Academy of Sciences. 2010;107:18664–18669. - PMC - PubMed
    1. Li Y, Sato Y, Yamaguchi N. Shift work and the risk of metabolic syndrome: a nested case-control study. Int J Occup Environ Health. 2011;17:154–160. - PubMed
    1. Garaulet M, Ortega FB, Ruiz JR, Rey-Lopez JP, Beghin L, et al. The HELENA study. Int J Obes; 2011. Short sleep duration is associated with increased obesity markers in European adolescents: effect of physical activity and dietary habits. - PubMed

Publication types