. 2012;7(5):e37485.
doi: 10.1371/journal.pone.0037485. Epub 2012 May 21.

Induction of selective blood-tumor barrier permeability and macromolecular transport by a biostable kinin B1 receptor agonist in a glioma rat model

Affiliations

Induction of selective blood-tumor barrier permeability and macromolecular transport by a biostable kinin B1 receptor agonist in a glioma rat model

Jérôme Côté et al. PLoS One. 2012.

Erratum in

  • PLoS One. 2012;7(6): doi/10.1371/annotation/6b95427c-645d-4f1b-a648-ceb215129583

Abstract

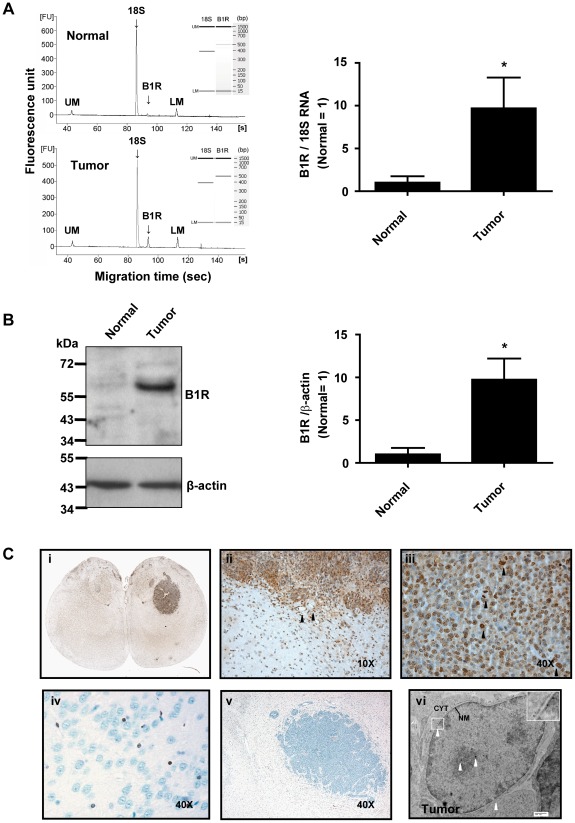
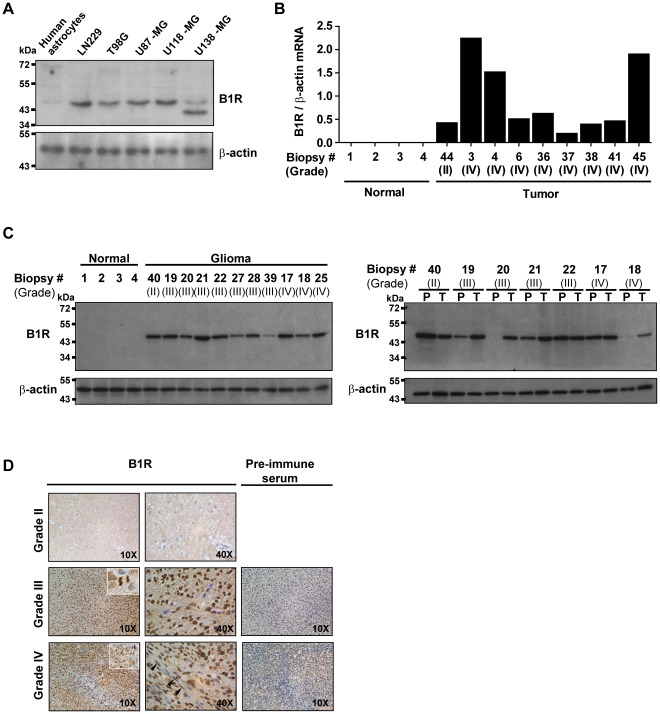
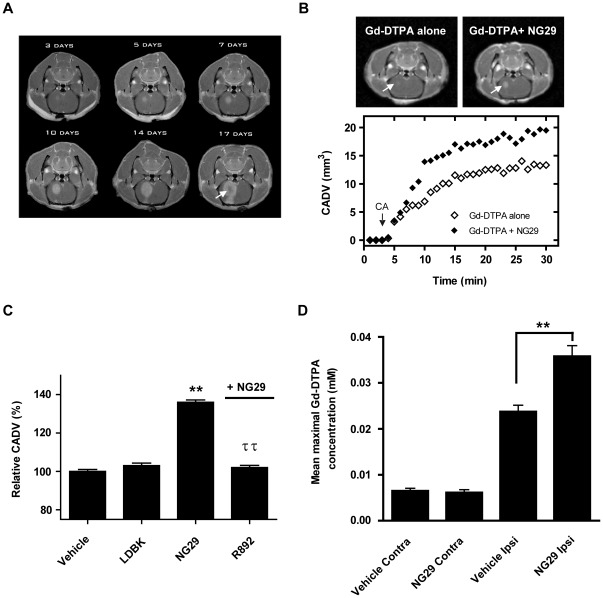
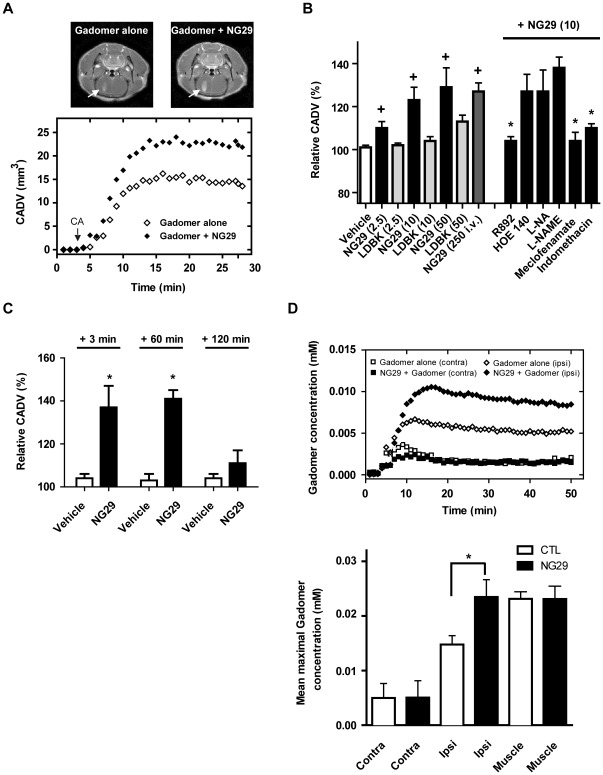
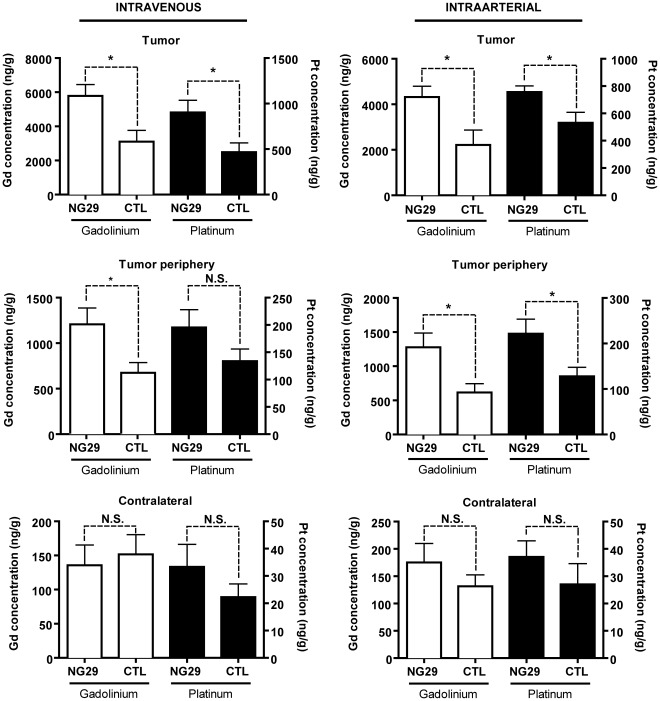
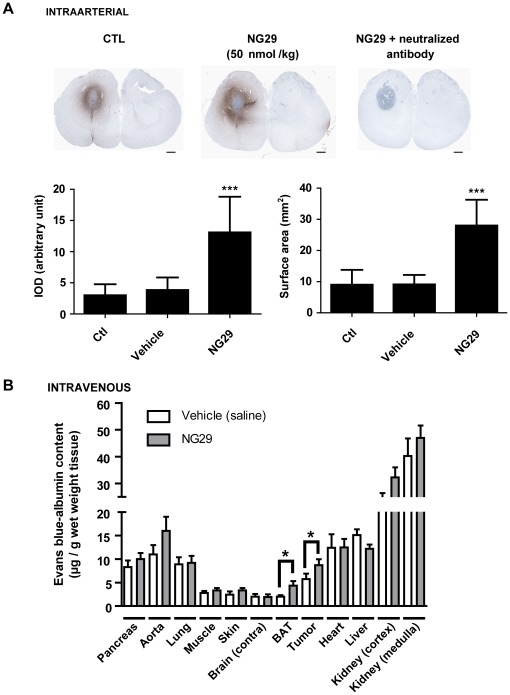
Treatment of malignant glioma with chemotherapy is limited mostly because of delivery impediment related to the blood-brain tumor barrier (BTB). B1 receptors (B1R), inducible prototypical G-protein coupled receptors (GPCR) can regulate permeability of vessels including possibly that of brain tumors. Here, we determine the extent of BTB permeability induced by the natural and synthetic peptide B1R agonists, LysdesArg(9)BK (LDBK) and SarLys[dPhe(8)]desArg(9)BK (NG29), in syngeneic F98 glioma-implanted Fischer rats. Ten days after tumor inoculation, we detected the presence of B1R on tumor cells and associated vasculature. NG29 infusion increased brain distribution volume and uptake profiles of paramagnetic probes (Magnevist and Gadomer) at tumoral sites (T(1)-weighted imaging). These effects were blocked by B1R antagonist and non-selective cyclooxygenase inhibitors, but not by B2R antagonist and non-selective nitric oxide synthase inhibitors. Consistent with MRI data, systemic co-administration of NG29 improved brain tumor delivery of Carboplatin chemotherapy (ICP-Mass spectrometry). We also detected elevated B1R expression in clinical samples of high-grade glioma. Our results documented a novel GPCR-signaling mechanism for promoting transient BTB disruption, involving activation of B1R and ensuing production of COX metabolites. They also underlined the potential value of synthetic biostable B1R agonists as selective BTB modulators for local delivery of different sized-therapeutics at (peri)tumoral sites.


Conflict of interest statement

Competing Interests: DF, WN and FG from Université de Sherbrooke hereby declare a duality of interest in view of their holding a patent made available to public in 2006 for the use of peptide kinin B1 receptor agonists in the treatment of brain cancer (Publication No. W0 2006/128293 A1). FG, DF and ML have received research funding from Tranzyme Pharma Inc. This company has no proprietary or financial interest in the outcome of the research. This does not alter the authors' adherence to all the PLoS ONE policies on sharing data and materials.

Figures

Figure 1
Figure 1. B1R expression in normal cerebral cortical and tumoral tissues of F98 glioma-bearing rats.
(A) Left: Representative electropherograms and gel-like images (insets) of RT-PCR products amplified from one tumor and autologous controlateral tissue (normal); LM and UM correspond to lower and upper internal markers, respectively. Right: Histographic representation of B1R expression from multiple normal and tumoral tissues. B1R mRNA level was normalized to the corresponding 18S level for each biopsy. n = 5 rats. *p<0.05 vs normal. (B) Western blot of rat brain soluble protein extracts probed with the anti-B1R antiserum AS434. Left: Rat brain tumor shows a robust single immunoreactive band around 60 kD. In the absence of antiserum, no band was seen in the rat brain samples (not shown). Right: Histographic representation of B1R expression from multiple normal and tumoral tissues. B1R protein level was normalized to the corresponding β-actin level for each biopsy. n = 4 rats. *p<0.05 vs normal. (C) The antiserum used for Western blot was also used to characterize the location of the proteins in rat brain cortical samples by IHC, along with HRP (panels i–v), and TEM immunogold labeling (panel vi). Photomicrographs illustrating positive B1R immunoreactivity in tumor (C, i–iii) and microvascular endothelial cells (ii) adjacent to the tumor (black arrowheads). Note the chromosomal staining on all tumor cells under mitosis (black arrowheads, iii). Negative control with preimmune serum showed no staining (v). Weak positive B1R staining of glial cells from both implanted (ii) and contralateral hemispheres (iv) is also shown. Magnification as indicated. EM photomicrograph (vi) showing subcellular localization of B1R in a glioma cancer cell (white arrowheads). Insert: digital enlargement of the delineated area (white rectangle) showing B1R immunoreactivity at both the inner and outer leaflets of the nuclear envelope. Scale bar = 500 nm. Photomicrographs of HRP labeling were equalized in terms of contrast, brightness and gamma using ImagePro Plus 5.1.
Figure 2
Figure 2. Overexpression of B1R in human glioma tissues.
(A) Detection of B1R in various human glioma cell lines and nontransformed counterparts, normal human astrocytes, by WB analysis using the anti-B1R antibody RC72. β-actin serves as a loading control in the lower panel. The doublet band in U138-MG cells may indicate degradation of B1R. (B) Comparative quantification of B1R mRNA levels among normal and glioma brain tissue samples was normalized against that of the corresponding β-actin. (C) Expression of B1R in normal versus tumoral tissue specimens (left panel) or in paired primary glioma (T) and peritumoral tissue biopsies (P) (right panel), with each pair obtained from a same patient. Western blot analysis was performed using the anti-B1R antiserum AS434. (D) Representative images from IHC assay of paraffin-embedded specimens of primary glioma tissue biopsies (WHO grades II–IV) exposed to pre-immune serum or AS434 antiserum. Optical magnification is indicated in the bottom-right corner of each image.
Figure 3
Figure 3. NG29 enhances transvascular delivery, distribution and accumulation of Magnevist within brain tumor tissues of F98-bearing rats.
(A) MRI contrast-enhanced detection of glial brain tumors in rats at day 3, 5, 7, 10 14 and 17 post-inoculation. Note the rapidly growing tumor over a 2-week time and the appearance of a necrotic center on the 17 day-image (white arrow) outgrowing its blood supply. Assessment of BTB disruption by MRI monitoring was conducted on the same animal on day 10 post-inoculation, corresponding to mid stage development of the tumor. (B) Representative axial Magnevist-enhanced T 1-weighted MR images depicting the brain of an F98-implanted rat before and after NG29 treatment (10 nmol/kg/min for 5 min i.c.) (left panel). Note the increase in the signal intensity at the tumor (white arrows). Temporal CADV calculated from the corresponding sets of images (1 image/51 s for 50 min) (bottom panel). (C) Relative CADV in percent determined following the infusion of the vehicle (saline), LDBK, NG29 (10 nmol/kg/min for 5 min) or NG29 (10 nmol/kg/min, 5 min) + R892 (20 nmol/kg/min, 5 min). Each bar represents the mean ± S.E.M. for 4 to 6 animals. **p<0.01 compared to vehicle-treated animals; ††p<0.01 compared to NG29-treated animals. (D) Histographic representation of average maximal Gd-DTPA concentrations in the ipsilateral (tumor-implanted) and the contralateral hemispheres following saline vehicle or NG29 treatment (10 nmol/kg/min)). Note the superior levels of Gd-DTPA (reflecting greater basal permeability) in the ipsi- versus contralateral tissues of vehicle-treated animals (not illustrated, ***p<0.001). **p<0.01 compared to vehicle-treated ipsilateral groups. Value represents the mean ± S.E.M. obtained with 3 animals.
Figure 4
Figure 4. NG29 increases transvascular delivery, distribution and accumulation of Gadomer within brain tumor tissues of F98-bearing rats.
(A) Representative axial Gadomer-enhanced T 1-weighted MR images depicting the brain of an F98-implanted rat before and after intracarotid NG29 treatment (10 nmol/kg/min for 5 min i.c.) (upper panels). Note the increase of the signal intensity at the tumor (white arrows). CADV in function of time calculated from the corresponding set of images (1 image/51 s for 50 min) (bottom panel). (B) Dose-, B1R-, PGs-dependence of NG29-induced BTB permeability. Numbers in parenthesis represent infusion rates in nmol/kg/min, for 5 min. The B2R antagonist HOE140 and the B1R antagonist R892 (both at 20 nmol/kg/min, for 5 min, i.c.) were infused simultaneously with NG29 while the non-selective nitric oxide synthase (NOS) inhibitors L-NA (5 mg/kg, i.v.) and L-NAME (20 mg/kg, i.v.), and the non-selective cyclooxygenase (COX) inhibitors Meclofenamate (5 mg/kg, i.v.) and Indomethacin (2.5 mg/kg, i.v.) were administered 30 min before the infusion of NG29. Note the effectiveness of NG29 administered by the i.v. (intrajugular) route. +p<0.05 compared to vehicle-treated animals; *p<0.05 compared to NG29 (10 nmol/kg/min)-treated animals. (C) Duration of the increase in BTB permeability caused by NG29 as detemined by relative CADV values. Gadomer was injected 3 min, 60 or 120 min following the start of the infusion (10 nmol/kg/min) of NG29 over 5 min. Each bar represents the mean ± S.E.M. for 3 to 7 animals. *p<0.05 compared to respective vehicle-treated animals. (D) Representative time course of Gadomer uptake in the ipsilateral (tumor-implanted) hemisphere and the contralateral hemisphere, before and after treatment with NG29 (10 nmol/kg/min for 5 min) (left panel). Histographic representation of average maximal Gadomer concentrations in the ipsilateral (tumor-implanted) and the contralateral hemispheres, and the facial muscle following NG29 treatment (right panel). As observed for Gd-DTPA, levels of Gadomer were higher in the ipsi- (tumors) than in contralateral (normal) tissues in CTL animals (not illustrated, ***p<0.001). *p<0.05 compared to untreated (Gadomer alone) ipsilateral groups. Value represents the mean ± S.E.M. obtained from 3 animals.
Figure 5
Figure 5. NG29 induces changes in local concentration of gadolinium and platinum in tumoral cerebral tissues.
Direct measures of drug concentration (ng/g of tissue) by ICP-MS in three different tissue extracts (tumor, tumor periphery and contralateral) from the brain of F98 glioma-bearing Fischer rats were made following intraarterial (carotid artery) or intravenous (femoral vein) injections of Gd-DTPA (Gd) (143 mM i.v.) and carboplatin (Pt) (20 mg/kg i.a. or i.v.) with the B1R agonist NG29 (250 nmol/kg i.a.; 5 µmol/kg i.v.) or saline (CTL). Note the difference in ordinate scaling between drug concentrations in contralateral and tumoral tissues. Data are mean ± S.E.M. of 7–10 rats in each group. *p<0.05 versus respective control; N.S.: non significant.
Figure 6
Figure 6. Systemic infusion of NG29 increases permeability and uptake of albumin within peritumoral tissue.
(A) Direct immunological staining of endogenous albumin in brain tissues from F98-implanted rats treated or not with intracarotid NG29 (50 nmol/kg/min for 5 min). Representative coronal sections of CTL-, vehicle- and NG29-treated rats immunostained with sheep anti-rat albumin HRP conjugated are shown in the upper panels. Scale bar: 1 mm. Histographic representation of integrated optical density (IOD) values (left) and stained surface areas (right) of immunoreactive albumin in respective animal groups (bottom panels). ***p<0.001 vs CTL. (B) Semi-quantitative measurement of Evans blue content (mg/g wet weight tissue) in several tissues after systemic intravenous (femoral) injection of saline vehicle or NG29 (5 µmol/kg i.v.) in F98 glioma bearing rats. Data are presented as means ± S.E.M. n = 5 to 7 animals per group. *p<0.05 vs respective vehicle group.

References

    1. Maroldi R, Ambrosi C, Farina D. Metastatic disease of the brain: extra-axial metastases (skull, dura, leptomeningeal) and tumour spread. Eur Radiol. 2005;15:617–626. - PubMed
    1. Rainov NG, Soling A, Heidecke V. Novel therapies for malignant gliomas: a local affair? Neurosurg Focus. 2006;20:E9. - PubMed
    1. Rich JN, Bigner DD. Development of novel targeted therapies in the treatment of malignant glioma. Nat Rev Drug Discov. 2004;3:430–446. - PubMed
    1. Hoffman S, Propp JM, McCarthy BJ. Temporal trends in incidence of primary brain tumors in the United States, 1985–1999. Neuro Oncol. 2006;8:27–37. - PMC - PubMed
    1. Mao Y, Desmeules M, Semenciw RM, Hill G, Gaudette L, et al. Increasing brain cancer rates in Canada. Can Med Assoc J. 1991;145:1583–1591. - PMC - PubMed

Publication types

MeSH terms