

Assessment method for a power analysis to identify differentially expressed pathways
- PMID: 22629411
- PMCID: PMC3356338
- DOI: 10.1371/journal.pone.0037510
Assessment method for a power analysis to identify differentially expressed pathways
Abstract
Gene expression data can provide a very rich source of information for elucidating the biological function on the pathway level if the experimental design considers the needs of the statistical analysis methods. The purpose of this paper is to provide a comparative analysis of statistical methods for detecting the differentially expression of pathways (DEP). In contrast to many other studies conducted so far, we use three novel simulation types, producing a more realistic correlation structure than previous simulation methods. This includes also the generation of surrogate data from two large-scale microarray experiments from prostate cancer and ALL. As a result from our comprehensive analysis of 41,004 parameter configurations, we find that each method should only be applied if certain conditions of the data from a pathway are met. Further, we provide method-specific estimates for the optimal sample size for microarray experiments aiming to identify DEP in order to avoid an underpowered design. Our study highlights the sensitivity of the studied methods on the parameters of the system.
Conflict of interest statement
Figures
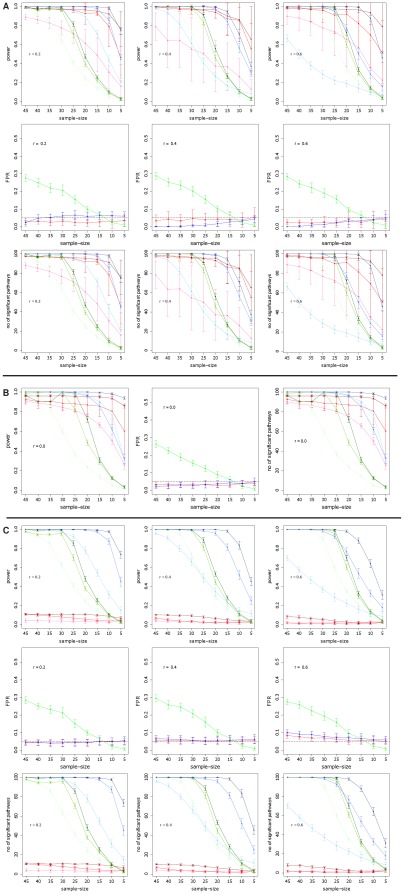
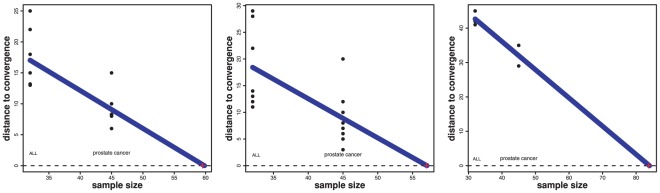
 (light color),
  (medium color),
  (dark color).
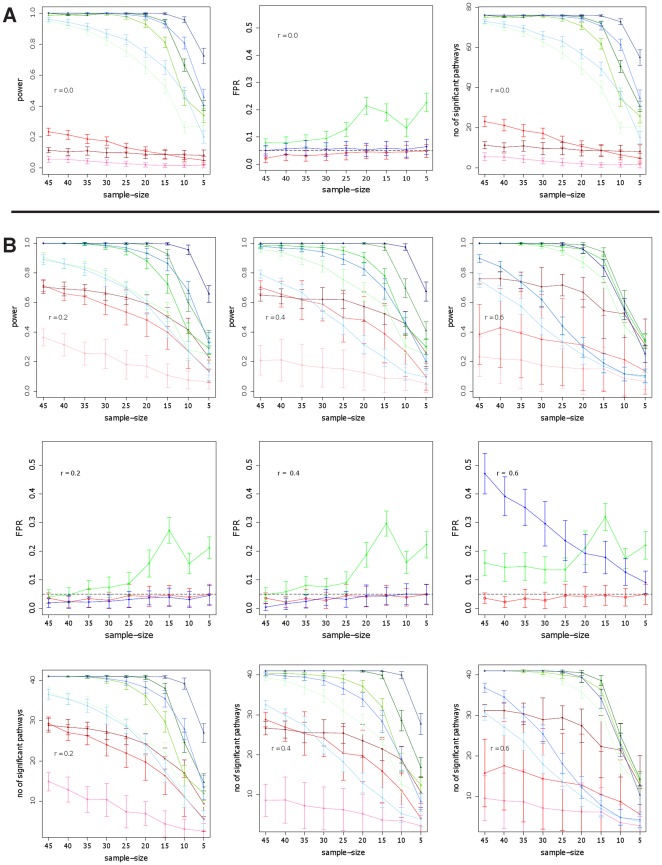
 (light color),
  (medium color),
  (dark color). Simulated data are from the protein network of yeast .
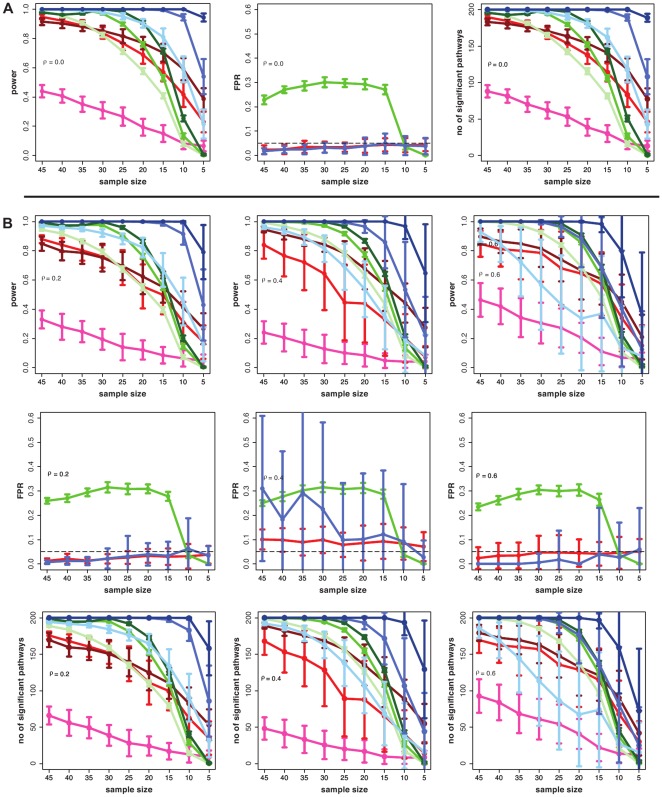
 (light color),
  (medium color),
  (dark color). Simulated data are from the transcriptional regulatory network of yeast .
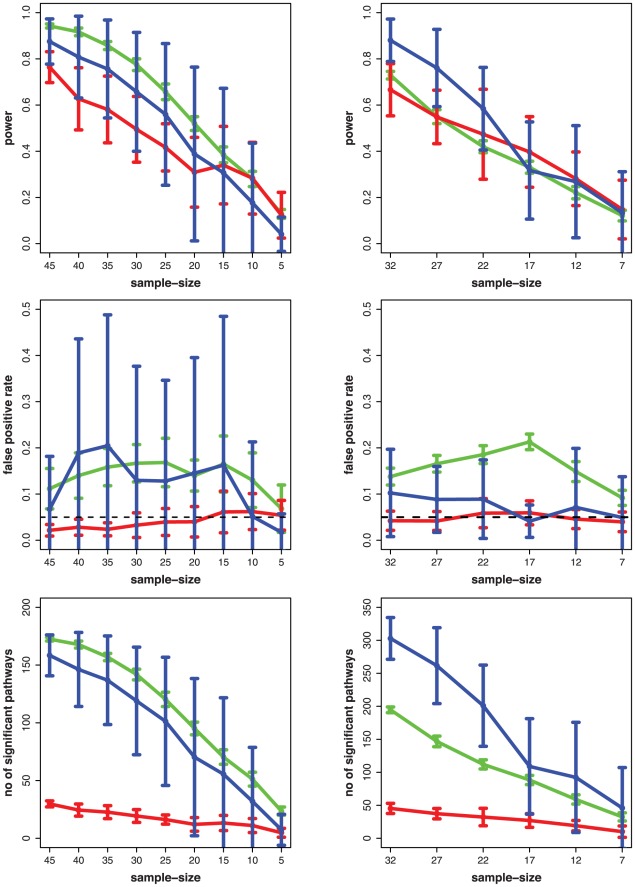
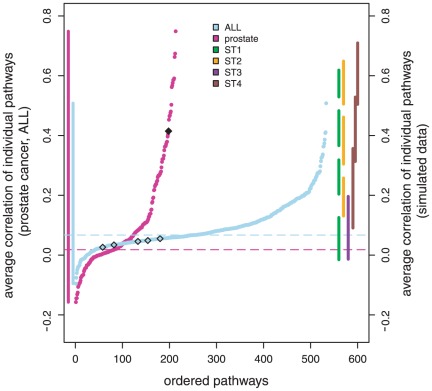
 ), ST II (orange -
  ), ST III (purple,
  ) and ST IV (brown -
  ) the projections of the range of correlation values is shown on the right-hand side.
Similar articles
-
Harnessing the complexity of gene expression data from cancer: from single gene to structural pathway methods.Biol Direct. 2012 Dec 10;7:44. doi: 10.1186/1745-6150-7-44. Biol Direct. 2012. PMID: 23227854 Free PMC article. Review.
-
A spline function approach for detecting differentially expressed genes in microarray data analysis.Bioinformatics. 2004 Nov 22;20(17):2954-63. doi: 10.1093/bioinformatics/bth339. Epub 2004 Jun 4. Bioinformatics. 2004. PMID: 15180936
-
A mixture model approach to sample size estimation in two-sample comparative microarray experiments.BMC Bioinformatics. 2008 Feb 25;9:117. doi: 10.1186/1471-2105-9-117. BMC Bioinformatics. 2008. PMID: 18298817 Free PMC article.
-
Comparison of seven methods for producing Affymetrix expression scores based on False Discovery Rates in disease profiling data.BMC Bioinformatics. 2005 Feb 10;6:26. doi: 10.1186/1471-2105-6-26. BMC Bioinformatics. 2005. PMID: 15705192 Free PMC article.
-
Using ANOVA to analyze microarray data.Biotechniques. 2004 Aug;37(2):173-5, 177. doi: 10.2144/04372TE01. Biotechniques. 2004. PMID: 15335204 Review.
Cited by
-
Extracting the Strongest Signals from Omics Data: Differentially Expressed Pathways and Beyond.Methods Mol Biol. 2017;1613:125-159. doi: 10.1007/978-1-4939-7027-8_7. Methods Mol Biol. 2017. PMID: 28849561 Free PMC article.
-
Knowledge-fused differential dependency network models for detecting significant rewiring in biological networks.BMC Syst Biol. 2014 Jul 24;8:87. doi: 10.1186/s12918-014-0087-1. BMC Syst Biol. 2014. PMID: 25055984 Free PMC article.
-
Gene Sets Net Correlations Analysis (GSNCA): a multivariate differential coexpression test for gene sets.Bioinformatics. 2014 Feb 1;30(3):360-8. doi: 10.1093/bioinformatics/btt687. Epub 2013 Nov 30. Bioinformatics. 2014. PMID: 24292935 Free PMC article.
-
Harnessing the complexity of gene expression data from cancer: from single gene to structural pathway methods.Biol Direct. 2012 Dec 10;7:44. doi: 10.1186/1745-6150-7-44. Biol Direct. 2012. PMID: 23227854 Free PMC article. Review.
-
Gene set analysis approaches for RNA-seq data: performance evaluation and application guideline.Brief Bioinform. 2016 May;17(3):393-407. doi: 10.1093/bib/bbv069. Epub 2015 Sep 4. Brief Bioinform. 2016. PMID: 26342128 Free PMC article.
References
-
- Alon U. An Introduction to Systems Biology: Design Principles of Biological Circuits. Boca Raton, FL: Chapman & Hall/CRC; 2006.
-
- Emmert-Streib F, Dehmer M, editors. Medical Biostatistics for Complex Diseases. Weinheim: Wiley-Blackwell; 2010.
-
- Kauffman S. Metabolic stability and epigenesis in randomly constructed genetic nets. Journal of Theoretical Biology. 1969;22:437–467. - PubMed
-
- Niiranen S, Ribeiro A, editors. Information Processing and Biological Systems. Berlin: Springer; 2011.
Publication types
MeSH terms
LinkOut - more resources
Full Text Sources
Research Materials
Miscellaneous
