

Integrative miRNA-mRNA profiling of adipose tissue unravels transcriptional circuits induced by sleep fragmentation
- PMID: 22629440
- PMCID: PMC3357342
- DOI: 10.1371/journal.pone.0037669
Integrative miRNA-mRNA profiling of adipose tissue unravels transcriptional circuits induced by sleep fragmentation
Abstract
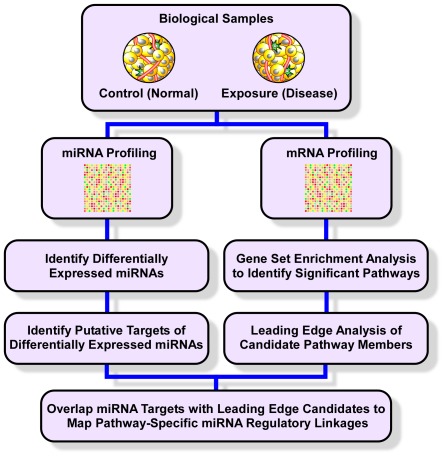
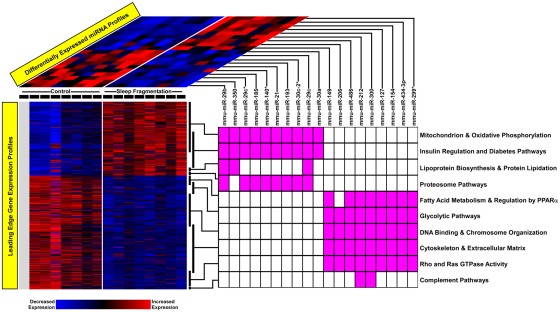
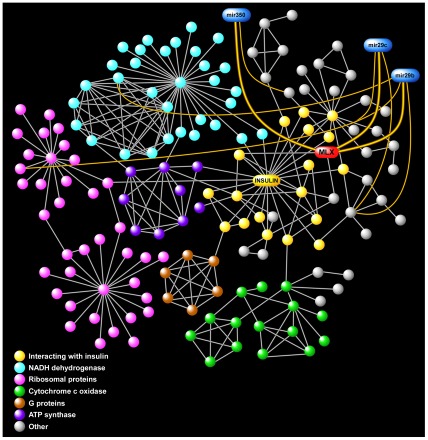
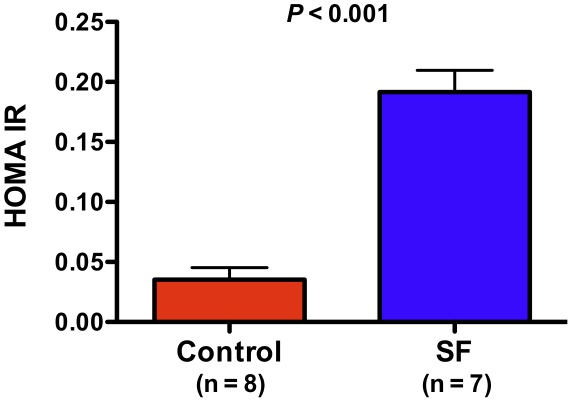
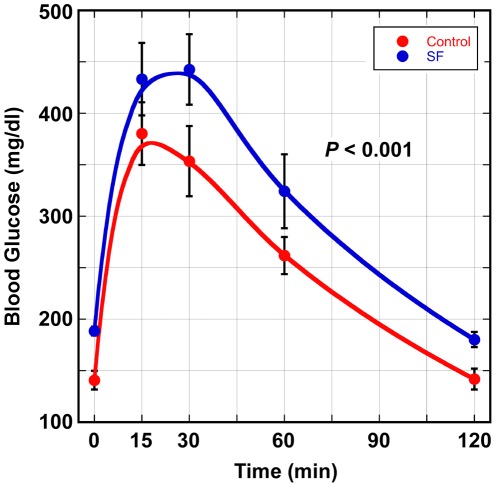
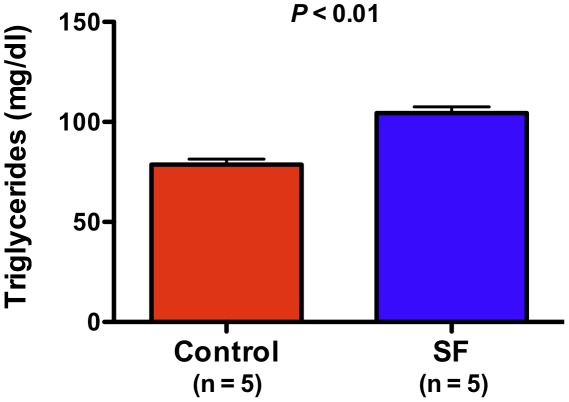
Obstructive sleep apnea (OSA) is a prevalent condition and strongly associated with metabolic disorders. Sleep fragmentation (SF) is a major consequence of OSA, but its contribution to OSA-related morbidities is not known. We hypothesized that SF causes specific perturbations in transcriptional networks of visceral fat cells, leading to systemic metabolic disturbances. We simultaneously profiled visceral adipose tissue mRNA and miRNA expression in mice exposed to 6 hours of SF during sleep, and developed a new computational framework based on gene set enrichment and network analyses to merge these data. This approach leverages known gene product interactions and biologic pathways to interrogate large-scale gene expression profiling data. We found that SF induced the activation of several distinct pathways, including those involved in insulin regulation and diabetes. Our integrative methodology identified putative controllers and regulators of the metabolic response during SF. We functionally validated our findings by demonstrating altered glucose and lipid homeostasis in sleep-fragmented mice. This is the first study to link sleep fragmentation with widespread disruptions in visceral adipose tissue transcriptome, and presents a generalizable approach to integrate mRNA-miRNA information for systematic mapping of regulatory networks.
Conflict of interest statement
Figures
Similar articles
-
Epigenomic profiling in visceral white adipose tissue of offspring of mice exposed to late gestational sleep fragmentation.Int J Obes (Lond). 2015 Jul;39(7):1135-42. doi: 10.1038/ijo.2015.38. Epub 2015 Mar 24. Int J Obes (Lond). 2015. PMID: 25801690 Free PMC article.
-
Sleep fragmentation promotes NADPH oxidase 2-mediated adipose tissue inflammation leading to insulin resistance in mice.Int J Obes (Lond). 2014 Apr;38(4):619-24. doi: 10.1038/ijo.2013.139. Epub 2013 Jul 30. Int J Obes (Lond). 2014. PMID: 23897221 Free PMC article.
-
Intermittent hypoxia activates temporally coordinated transcriptional programs in visceral adipose tissue.J Mol Med (Berl). 2012 Apr;90(4):435-45. doi: 10.1007/s00109-011-0830-7. Epub 2011 Nov 16. J Mol Med (Berl). 2012. PMID: 22086141
-
Molecular signatures of obstructive sleep apnea in adults: a review and perspective.Sleep. 2009 Apr;32(4):447-70. doi: 10.1093/sleep/32.4.447. Sleep. 2009. PMID: 19413140 Free PMC article. Review.
-
Expression of miRNA in obesity and insulin resistance: a review.Endokrynol Pol. 2021;72(1):73-80. doi: 10.5603/EP.a2021.0002. Endokrynol Pol. 2021. PMID: 33749820 Review.
Cited by
-
Reproducibility of quantitative real-time PCR assay in microRNA expression profiling and comparison with microarray analysis in narcolepsy.Springerplus. 2015 Dec 24;4:812. doi: 10.1186/s40064-015-1613-3. eCollection 2015. Springerplus. 2015. PMID: 26722632 Free PMC article.
-
Transcriptional landscape of glomerular parietal epithelial cells.PLoS One. 2014 Aug 15;9(8):e105289. doi: 10.1371/journal.pone.0105289. eCollection 2014. PLoS One. 2014. PMID: 25127402 Free PMC article.
-
The impact of sleep disorders on glucose metabolism: endocrine and molecular mechanisms.Diabetol Metab Syndr. 2015 Mar 24;7:25. doi: 10.1186/s13098-015-0018-3. eCollection 2015. Diabetol Metab Syndr. 2015. PMID: 25834642 Free PMC article.
-
Exosome and Macrophage Crosstalk in Sleep-Disordered Breathing-Induced Metabolic Dysfunction.Int J Mol Sci. 2018 Oct 29;19(11):3383. doi: 10.3390/ijms19113383. Int J Mol Sci. 2018. PMID: 30380647 Free PMC article. Review.
-
A pathway-based analysis on the effects of obstructive sleep apnea in modulating visceral fat transcriptome.Sleep. 2013 Jan 1;36(1):23-30. doi: 10.5665/sleep.2294. Sleep. 2013. PMID: 23288968 Free PMC article.
References
-
- Young T, Palta M, Dempsey J, Skatrud J, Weber S, et al. The occurrence of sleep-disordered breathing among middle-aged adults. N Engl J Med. 1993;328:1230–1235. - PubMed
-
- Rosen CL, Larkin EK, Kirchner HL, Emancipator JL, Bivins SF, et al. Prevalence and risk factors for sleep-disordered breathing in 8- to 11-year-old children: association with race and prematurity. J Pediatr. 2003;142:383–389. - PubMed
-
- Gozal D. Morbidity of obstructive sleep apnea in children: facts and theory. Sleep Breath. 2001;5:35–42. - PubMed
Publication types
MeSH terms
Substances
Grants and funding
LinkOut - more resources
Full Text Sources
