. 2012;7(5):e37899.
doi: 10.1371/journal.pone.0037899. Epub 2012 May 22.

Weekly intra-amniotic IGF-1 treatment increases growth of growth-restricted ovine fetuses and up-regulates placental amino acid transporters

Affiliations

Weekly intra-amniotic IGF-1 treatment increases growth of growth-restricted ovine fetuses and up-regulates placental amino acid transporters

Jibran A Wali et al. PLoS One. 2012.

Abstract

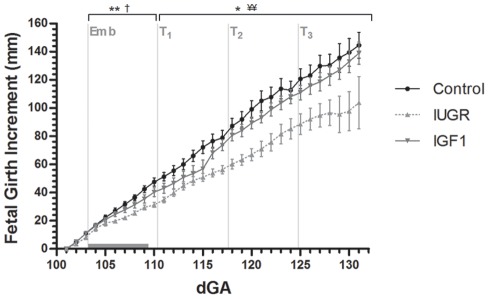
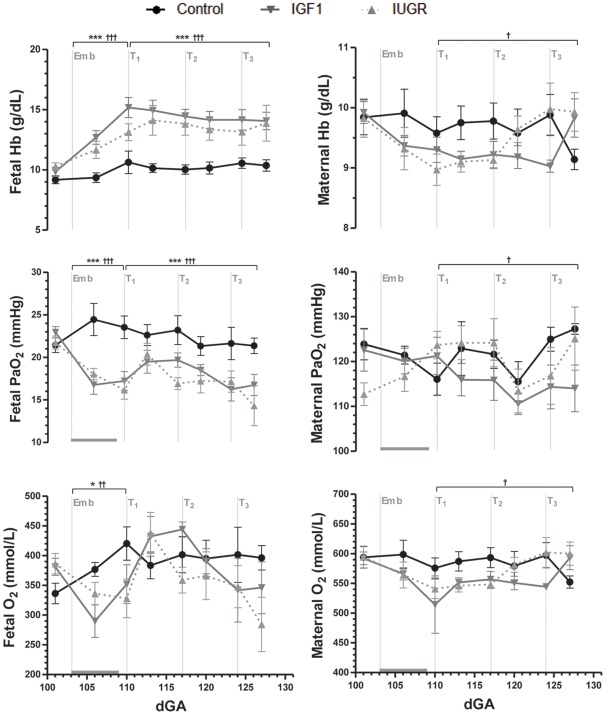
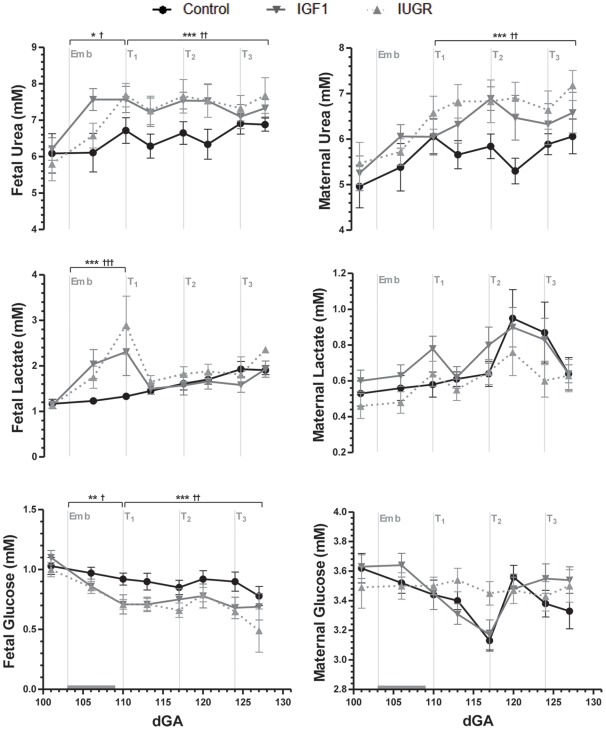
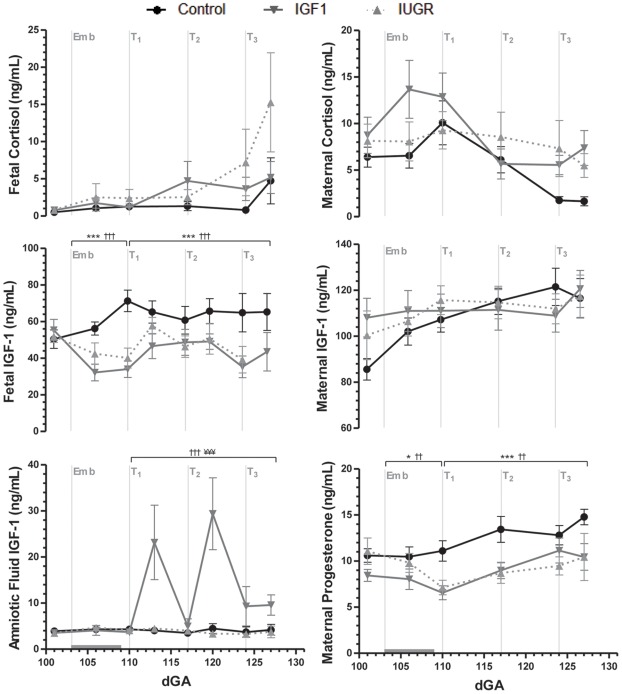
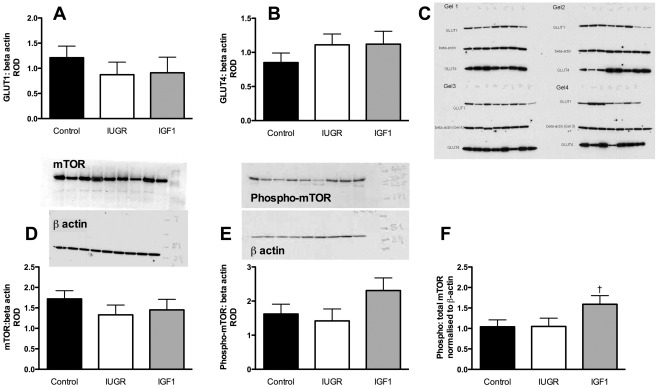
Frequent treatment of the growth-restricted (IUGR) ovine fetus with intra-amniotic IGF-1 increases fetal growth. We aimed to determine whether increased growth was maintained with an extended dosing interval and to examine possible mechanisms. Pregnant ewes were allocated to three groups: Control, and two IUGR groups (induced by placental embolization) treated with weekly intra-amniotic injections of either saline (IUGR) or 360 µg IGF-1 (IGF1). IUGR fetuses were hypoxic, hyperuremic, hypoglycemic, and grew more slowly than controls. Placental glucose uptake and SLC2A1 (GLUT2) mRNA levels decreased in IUGR fetuses, but SLC2A3 (GLUT3) and SLC2A4 (GLUT4) levels were unaffected. IGF-1 treatment increased fetal growth rate, did not alter uterine blood flow or placental glucose uptake, and increased placental SLC2A1 and SLC2A4 (but not SLC2A3) mRNA levels compared with saline-treated IUGR animals. Following IGF-1 treatment, placental mRNA levels of isoforms of the system A, y(+), and L amino acid transporters increased 1.3 to 5.0 fold, while the ratio of phosphorylated-mTOR to total mTOR also tended to increase. Weekly intra-amniotic IGF-1 treatment provides a promising avenue for intra-uterine treatment of IUGR babies, and may act via increased fetal substrate supply, up-regulating placental transporters for neutral, cationic, and branched-chain amino acids, possibly via increased activation of the mTOR pathway.


Conflict of interest statement

Competing Interests: The authors have declared that no competing interests exist.

Figures

Figure 1
Figure 1. Fetal growth rate presented as the increase in girth size (mm) relative to the starting date of measurements (101 dGA).
Data points are the means with SEM. Emb marks the start of the embolization period, which is indicated by the horizontal gray bar. At T1, T2 and T3 the IUGR and IGF1 groups received intra-amniotic saline or IGF-1 injections, respectively. * p<0.05 and ** p<0.01 for IUGR vs. Control; † p<0.05 for IGF1 vs. Control; ¥¥ p<0.01 for IGF1 vs. IUGR.
Figure 2
Figure 2. Fetal and maternal arterial oxygen and hemoglobin concentrations.
Data are means with SEM. Emb marks the start of the embolization period, which is indicated by the horizontal gray bar. At T1, T2 and T3 the IUGR and IGF1 groups received either a saline or IGF-1 intra-amniotic injection, respectively. Hb  =  hemoglobin. * p<0.05 and *** p<0.001 for IUGR vs. Control; p<0.05, †† p<0.01 and ††† p<0.001 for IGF1 vs. Control.
Figure 3
Figure 3. Fetal and maternal plasma metabolite concentrations.
Data are means with SEM. Emb marks the start of the embolization period, which is indicated by the horizontal gray bar. At T1, T2 and T3 the IUGR and IGF1 groups received either a saline or IGF-1 intra-amniotic injection, respectively. * p<0.05, ** p<0.01 and *** p<0.001 for IUGR vs. Control; p<0.05, †† p<0.01 and ††† p<0.001 for IGF1 vs. Control.
Figure 4
Figure 4. Hormone concentrations in fetal plasma, maternal plasma and amniotic fluid.
Data are means with SEM. Emb marks the start of the embolization period, which is indicated by the horizontal gray bar. At T1, T2 and T3 the IUGR and IGF1 groups received either a saline or IGF-1 intra-amniotic injection, respectively. * p<0.05 and *** p<0.001 for IUGR vs. Control; †† p<0.01 and ††† p<0.001 for IGF1 vs. Control; ¥¥¥ p<0.001 for IGF1 vs. IUGR.
Figure 5
Figure 5. Placental protein levels of glucose transporters 1 and 4 and mammalian target of rapamycin (mTOR).
[A] SLC2A1 (GLUT1), [B] SLC2A4 (GLUT4), [C] total mTOR, [D] phosphorylated mTOR (phospho-mTOR), and [E] the ratio of phospho-mTOR to total mTOR. Data are relative optical densities (ROD, mean±SEM) of the protein of interest normalised to the ROD of the loading control (beta-actin). Black bar, control, n = 11; white bar, IUGR, n = 9; grey bar, IGF1, n = 7. Complete gels are shown, with all four gels for SLC2A1 and SLC2A4 and representative gels for mTOR and phospho mTOR. p = 0.06 compared with IUGR.

References

    1. Rosenberg A. The IUGR newborn. Semin Perinatol. 2008;32:219–224. - PubMed
    1. Ross MG, Beall MH. Adult sequelae of intrauterine growth restriction. Semin Perinatol. 2008;32:213–218. - PMC - PubMed
    1. Albertsson-Wikland K, Boguszewski M, Karlberg J. Children born small-for-gestational age: postnatal growth and hormonal status. Horm Res. 1998;49:7–13. - PubMed
    1. GRIT-Study-Group. A randomised trial of timed delivery for the compromised preterm fetus: short term outcomes and Bayesian interpretation. BJOG. 2003;110:27–32. - PubMed
    1. Crump C, Winkleby MA, Sundquist K, Sundquist J. Risk of hypertension among young adults who were born preterm: a Swedish national study of 636,000 births. Am J Epidemiol. 2011;173:797–803. - PMC - PubMed

Publication types

MeSH terms

Substances