. 2012;7(5):e37990.
doi: 10.1371/journal.pone.0037990. Epub 2012 May 22.

Paxillin and Hic-5 interaction with vinculin is differentially regulated by Rac1 and RhoA

Affiliations

Paxillin and Hic-5 interaction with vinculin is differentially regulated by Rac1 and RhoA

Nicholas O Deakin et al. PLoS One. 2012.

Abstract

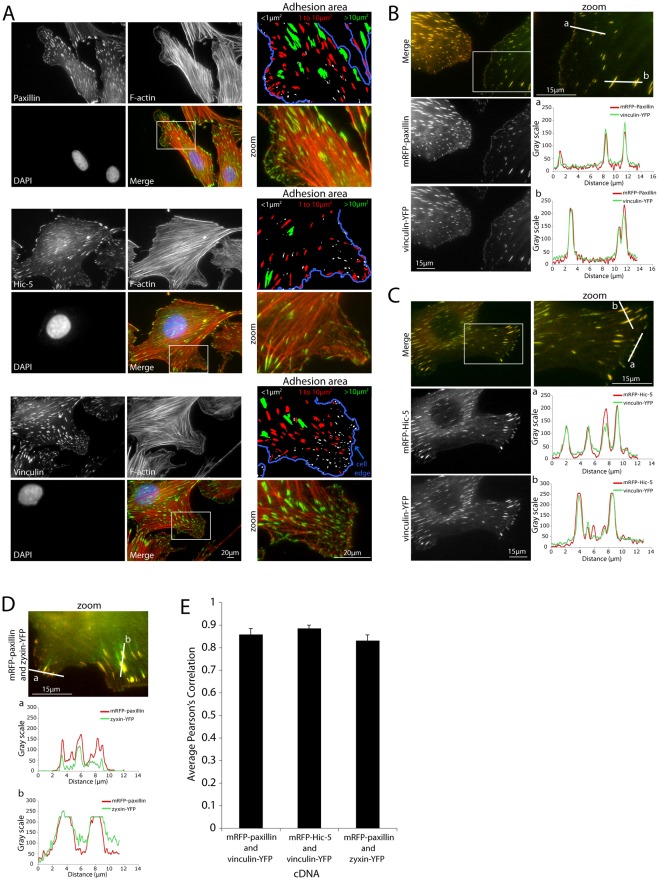
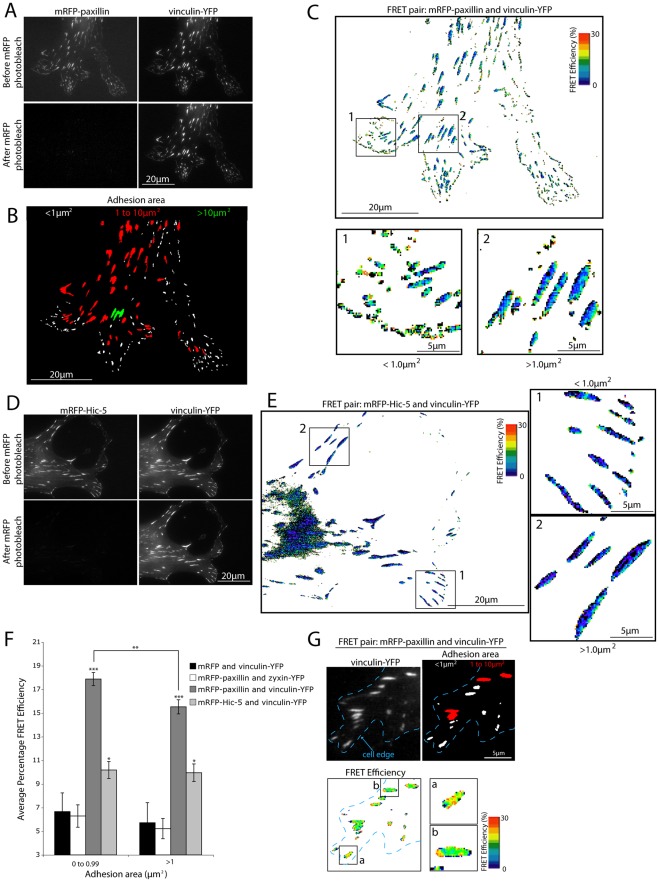
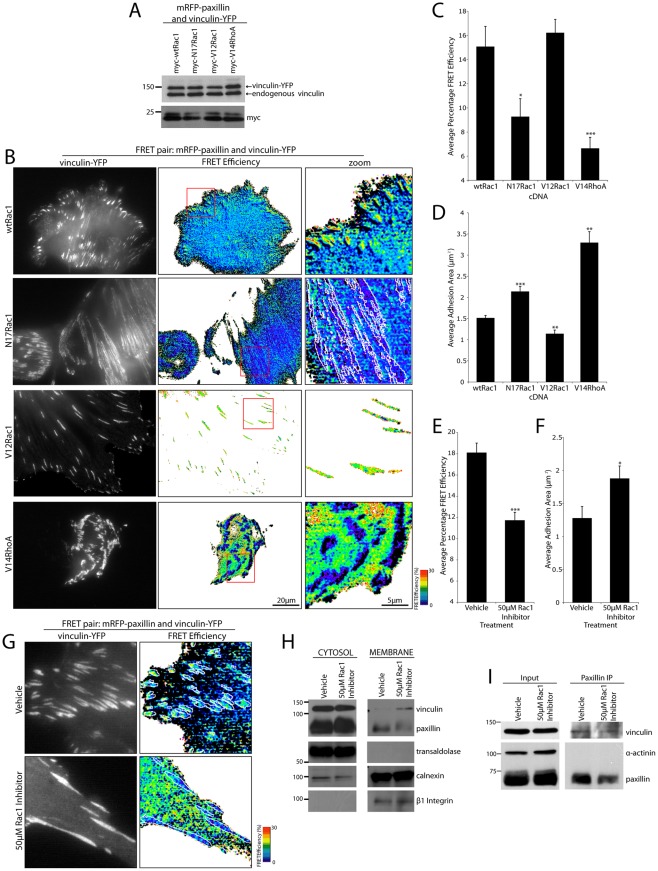
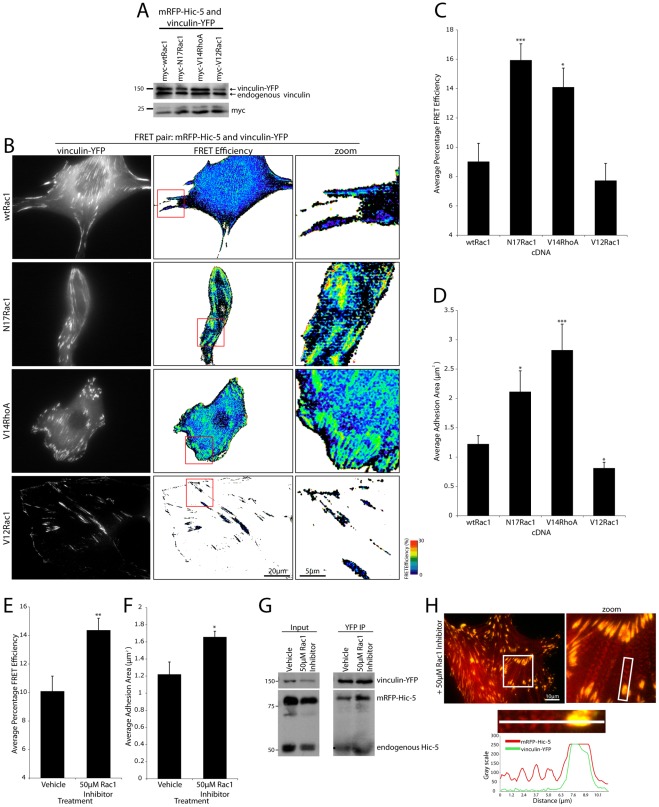
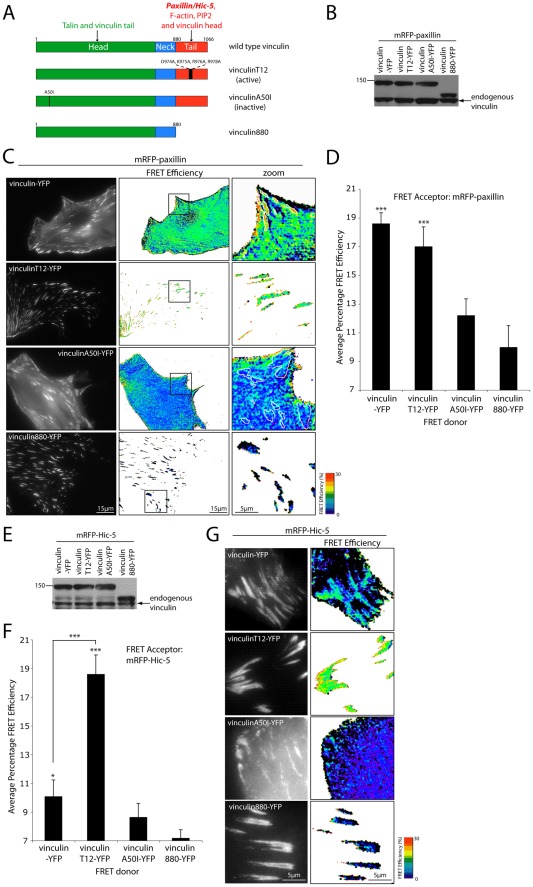
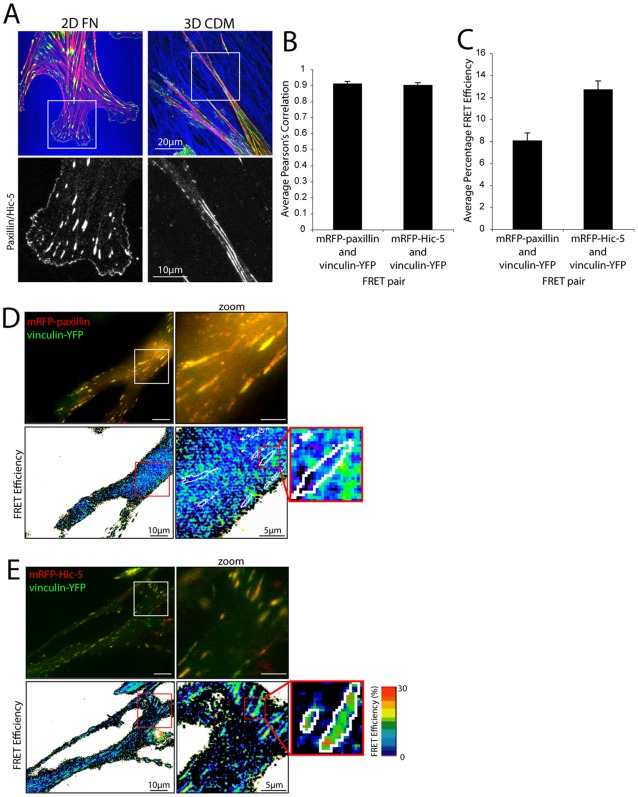
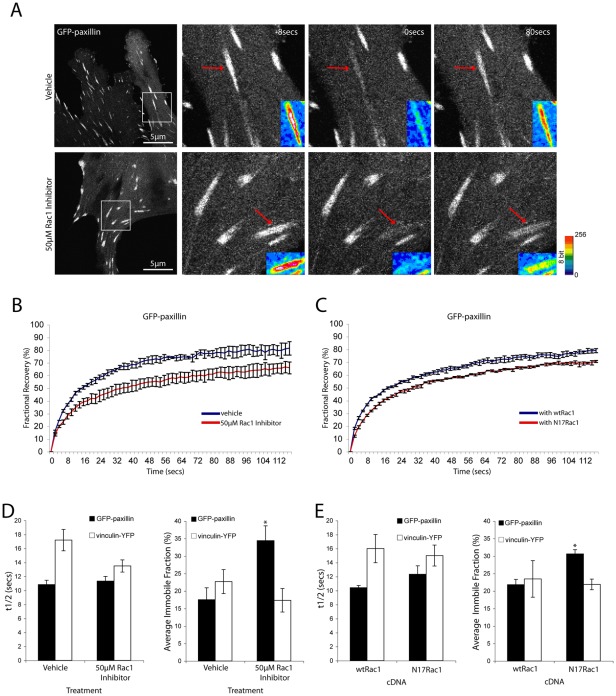
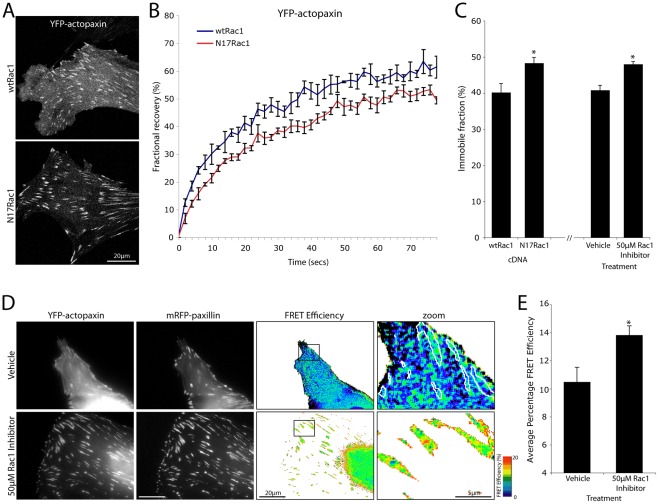
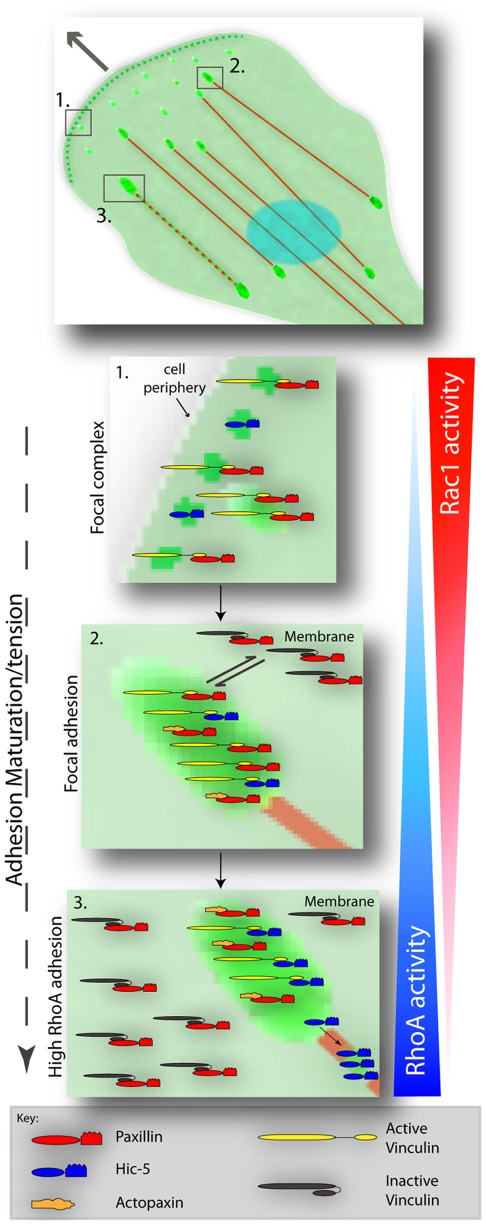
Cell migration is of paramount importance to organism development and maintenance as well as multiple pathological processes, including cancer metastasis. The RhoGTPases Rac1 and RhoA are indispensable for cell migration as they regulate cell protrusion, cell-extracellular matrix (ECM) interactions and force transduction. However, the consequences of their activity at a molecular level within the cell remain undetermined. Using a combination of FRET, FRAP and biochemical analyses we show that the interactions between the focal adhesion proteins vinculin and paxillin, as well as the closely related family member Hic-5 are spatially and reciprocally regulated by the activity of Rac1 and RhoA. Vinculin in its active conformation interacts with either paxillin or Hic-5 in adhesions in response to Rac1 and RhoA activation respectively, while inactive vinculin interacts with paxillin in the membrane following Rac1 inhibition. Additionally, Rac1 specifically regulates the dynamics of paxillin as well as its binding partner and F-actin interacting protein actopaxin (α-parvin) in adhesions. Furthermore, FRET analysis of protein:protein interactions within cell adhesions formed in 3D matrices revealed that, in contrast to 2D systems vinculin interacts preferentially with Hic-5. This study provides new insight into the complexity of cell-ECM adhesions in both 2D and 3D matrices by providing the first description of RhoGTPase-coordinated protein:protein interactions in a cellular microenvironment. These data identify discrete roles for paxillin and Hic-5 in Rac1 and RhoA-dependent cell adhesion formation and maturation; processes essential for productive cell migration.


Conflict of interest statement

Competing Interests: The authors have declared that no competing interests exist.

Figures

Figure 1
Figure 1. Endogenous and exogenous paxillin, Hic-5 and vinculin colocalize in integrin-mediated adhesions of varying size.
(A) Immunofluorescence images of NIH 3T3 cells spread on 2D fibronectin for 4hrs and stained for paxillin (top panels), Hic-5 (middle panels) and vinculin (bottom panels). Masks indicate that the endogenous proteins localize to all adhesions (<1 μm2 to >10 μm2). Blue line indicates the cell edge as determined by F-actin staining. Representative images of cells co-expressing (B) mRFP-paxillin and (C) mRFP-Hic-5 with vinculin-YFP. Line profiles indicate fluorophore-tagged protein colocalization in all adhesion structures. (D) Representative image and line profiles of mRFP-paxillin and zyxin-YFP colocalization in adhesions. (E) Average Pearson's Correlation analyses indicate a high level of colocalization of exogenous proteins. Error bars are standard errors of the mean.
Figure 2
Figure 2. Paxillin and Hic-5 are within FRET proximity of vinculin in adhesions.
(A) Raw images of NIH 3T3 cells expressing the donor (vinculin-YFP) and acceptor (mRFP-paxillin) pair used for FRET calculations before and after acceptor photobleaching. The lower panel images highlight the complete photobleaching of the acceptor protein. (B) Mask image of the vinculin-YFP image indicating the variation of adhesion contact area. (C) FRET efficiency image of mRFP-paxillin and vinculin-YFP with zoomed images, indicating FRET in both small and large adhesions. (D) Raw images of NIH 3T3 cells expressing the donor (vinculin-YFP) and acceptor (mRFP-Hic-5) pair used for FRET calculations. (E) FRET efficiency image of mRFP-Hic-5 and vinculin-YFP with zoomed images indicating FRET in both small and large adhesions. (F) Quantitation of average percentage FRET efficiency of indicated FRET pairs in adhesions with small, focal complex-like areas (<1 μm2) and larger more mature adhesions (>1 μm2). Error bars are standard errors of the mean and are compiled from analysis of all adhesions from a minimum of 9 cells from 3 individual experiments (measurements were made from 450 to 2500 individual adhesions). Statistical analyses are relative to the mRFP and vinculin-YFP FRET control unless otherwise indicated, *  = p<0.05 and *** = p<0.0005. (G) Representative image of a vinculin-YFP-expressing NIH 3T3 cell with adhesions of (a) <1 μm2 and (b) 1 to 10 μm2 indicating an increase in measured FRET efficiency between mRFP-paxillin and vinculin-YFP in the smaller focal complex-like adhesions. Dashed blue line indicates the cell edge.
Figure 3
Figure 3. The interaction between paxillin and vinculin in adhesions is spatially regulated by the activity of the RhoGTPases.
(A) Western blot of vinculin-YFP and myc-tagged Rac1 and RhoA mutant expression in NIH 3T3 cells used for FRET analyses. (B) Representative donor (vinculin-YFP) and FRET efficiency images indicating that in the presence of wild type (wt) or active (V12Rac1) Rac1, paxillin and vinculin are within FRET proximity. In contrast, inhibition of Rac1 (N17Rac1) or activation of RhoA (V14RhoA) results in a loss of adhesion-localized FRET. FRET image zooms highlight representative FRET pattern of cells as indicated. (C) Quantitation of average FRET efficiency of mRFP-paxillin and vinculin-YFP in all adhesions of cells expressing activation mutants of Rac1 and RhoA. (D) Adhesion area calculations for cells expressing mRFP-paxillin and vinculin-YFP with indicated Rac1 and RhoA mutants. Expression of the active V12Rac1 mutant promotes the formation of smaller adhesions, while the dominant negative N17Rac1 or active V14RhoA constructs induce an increase in adhesion area. Error bars are standard error of the mean from cells used for FRET calculations. (E) Quantitation of average FRET efficiency of mRFP-paxillin and vinculin-YFP in all adhesions of cells in the presence of vehicle (dH20) or 50 μM Rac1 inhibitor (NSC23766). (F) Quantitation of average adhesion area in cells treated with vehicle or 50 μM Rac1 inhibitor. Error bars are standard error of the mean and values calculated from all adhesions from a minimum of 10 cells from 3 individual experiments. * = p<0.05, ** = p<0.005 and *** = p<0.0005. (G) Representative images of NIH 3T3 cells displaying increased vinculin-YFP cytosol/membrane localization indicating positive FRET in both adhesion contacts and areas outside integrin-mediated adhesions. Treatment with 50 μM Rac1 inhibitor decreased FRET in adhesion contacts with cytosolic/membrane FRET still observed. White lines highlight vinculin-YFP-positive adhesion areas. (H) Western blots indicating an increase in endogenous vinculin recruitment to the membrane-enriched fraction of cells treated with 50 μM Rac1 inhibitor. (I) Representative Western blots indicating no effect of the Rac1 inhibitor on the ability of endogenous paxillin and vinculin to coimmunoprecipitate, n = 3 individual experiments.
Figure 4
Figure 4. Rac1 inhibition or RhoA activation promotes mRFP-Hic-5 and vinculin-YFP FRET in adhesions.
(A) Western blots of donor and myc-tagged Rac1 and RhoA mutant expression. (B) Representative images of mRFP-Hic-5 and vinculin-YFP FRET in adhesions of cells expressing wtRac1, N17Rac1, V14RhoA or V12Rac1 constructs. FRET image zooms highlight representative FRET pattern of cells as indicated. (C) Quantitation of the FRET efficiency between mRFP-Hic-5 and vinculin-YFP in all adhesions and (D) average adhesion area in the presence of Rac1/RhoA activation mutants. Error bars represent standard error of the mean and are calculated from a minimum of 10 cells from 3 individual experiments. (E) Quantitation of the FRET efficiency between mRFP-Hic-5 and vinculin-YFP and (F) average adhesion area in the presence of 50 μM Rac1 inhibitor. Error bars are standard error of the mean from a minimum of 13 cells from 4 individual experiments. * = p<0.05, ** = p<0.005 and *** = p<0.0005. (G) Western blots of vinculin-YFP and Hic-5 coimmunoprecipitation. A small but consistent increase in the interaction of vinculin-YFP with both endogenous and fluorophore-tagged Hic-5 was seen upon Rac1 inhibition. Data is representative of n = 4 individual experiments. (H) Images and line profile of mRFP-Hic-5 localization to stress fibers upon Rac1 inhibition.
Figure 5
Figure 5. Vinculin activation state spatially regulates its interaction with paxillin and Hic-5.
(A) Schematic of vinculin highlighting the distinct domains and associated binding partners as well as mutant constructs used for FRET experiments. (B) Western blot of vinculin-YFP (FRET donor) mutant protein expression in mRFP-paxillin-expressing NIH 3T3 cells. (C) Representative images and (D) quantitation of vinculin-YFP activity mutant's FRET efficiency with mRFP-paxillin. Error bars are standard error of the mean from a minimum of 12 cells from 3 individual experiments. Statistical analyses are relative to the vinculin880-YFP mutant, which lacks the paxillin interacting domain. (E) Western blot of vinculin-YFP (FRET donor) mutant protein expression in mRFP-Hic-5-expressing NIH 3T3 cells. (F) Quantitation and (G) representative images of mRFP-Hic-5 FRET with vinculin-YFP mutants. * = p<0.05 and *** = p<0.0005.
Figure 6
Figure 6. Vinculin preferentially interacts with Hic-5 rather than paxillin in 3D adhesion contacts.
(A) Images of NIH 3T3 cells spread on 2D fibronectin (FN) or 3D cell-derived matrix (CDM) for 4hrs stained for paxillin/Hic-5 (green), fibronectin (blue) and F-actin (red). (B) Average Pearson's Correlation analyses of mRFP-paxillin or mRFP-Hic-5 with vinculin-YFP in 3D adhesions reveals no significant difference in colocalization. (C) Quantitation and representative images of (D) mRFP-paxillin and (E) mRFP-Hic-5 FRET efficiency with vinculin-YFP in 3D adhesions demonstrating FRET between vinculin-YFP and mRFP-Hic-5 but not mRFP-paxillin in 3D adhesions. Error bars are standard error of the mean and are calculated from a minimum of 15 cells from 3 individual experiments.
Figure 7
Figure 7. Rac1 inhibition specifically affects the dynamics of paxillin in adhesions.
(A) Images of FRAP time series of GFP-paxillin-expressing NIH 3T3 cells ±50 μM Rac1 inhibitor. Inset are pseudo-colored images of the adhesions undergoing FRAP analysis highlighting a reduction in the GFP-paxillin recovery. (B) Compiled fluorescence recovery curves for GFP-paxillin in adhesions from n = 3 individual experiments ± 50μM Rac1 inhibitor and (C) with wtRac1 or N17Rac1. (D) Quantitation of the t1/2 of fluorescence recovery and immobile fraction for GFP-paxillin and vinculin-YFP ±50 μM Rac1inhibitor. (E) Quantitation of the t1/2 of fluorescence recovery and immobile fraction for GFP-paxillin and vinculin-YFP with wtRac1 or N17Rac1. FRAP analyses reveal a significant increase in the immobile fraction of GFP-paxillin, but not vinculin-YFP in cells with decreased Rac1 activity. Error bars are standard error of the mean. * = p<0.05.
Figure 8
Figure 8. Paxillin is immobilized in adhesions upon Rac1 inhibition through an increased interaction with actopaxin.
(A) Representative images of YFP-actopaxin-expressing NIH 3T3 cells used for FRAP analyses. YFP-actopaxin exhibits robust adhesion localization but a reduction in non-adhesion localization upon Rac1 inhibition. (B) Compiled FRAP recovery curves for YFP-actopaxin in the presence of wtRac1 or N17Rac1. Error bars represent standard error of the mean and n = 3 individual experiments. (C) Immobile fraction quantitation for YFP-actopaxin with wtRac1, N17Rac1 and ±50 μM Rac1inhibitor. Error bars are standard error of the mean from a minimum of n = 3 individual experiments. (D) Images and (E) quantitation of YFP-actopaxin and mRFP-paxillin FRET in adhesion contacts upon Rac1 inhibition. Error bars are standard error of the mean and are from all adhesions from a minimum of 11 cells from 3 individual experiments. * = p<0.05.
Figure 9
Figure 9. Schematic representation highlighting paxillin and Hic-5 molecular interactions during RhoGTPase-dependent adhesion maturation.
(1) At the leading edge of a migrating cell high Rac1 activity stimulates nascent adhesion formation in which the interaction of paxillin with vinculin in its active conformation is stimulated to promote adhesion stabilization and maturation. (2) As adhesion contacts mature the levels of Rac1 and RhoA likely balance and an equilibrium is reached and a steady state maintained whereby paxillin, and to a lesser extent Hic-5, is interacting with active vinculin in adhesions. Furthermore, at steady state paxillin is also in a complex with vinculin in its inactive state in the membrane. (3) Elevated levels of RhoA activity as is observed in cells under tension induces the loss of paxillin-vinculin interaction and a distinct switch to paxillin binding to actopaxin, which likely stabilizes the complex in adhesions. An increase in RhoA and concomitant decrease in Rac1 activity promotes the direct interaction of Hic-5 with active vinculin in contractile adhesions and stimulates the redistribution of Hic-5 to stress fibers to function potentially in adhesion strengthening and/or mechanosensing.

References

    1. Hynes RO. Integrins: Bidirectional, allosteric signaling machines. Cell. 2002;110(6):673–687. - PubMed
    1. Kim C, Ye F, Ginsberg MH. Regulation of integrin activation. Annu Rev Cell Dev Biol. 2011;27:321–345. - PubMed
    1. Parsons JT, Horwitz AR, Schwartz MA. Cell adhesion: Integrating cytoskeletal dynamics and cellular tension. Nat Rev Mol Cell Biol. 2010;11(9):633–643. - PMC - PubMed
    1. Zaidel-Bar R, Itzkovitz S, Ma'ayan A, Iyengar R, Geiger B. Functional atlas of the integrin adhesome. Nat Cell Biol. 2007;9(8):858–867. - PMC - PubMed
    1. Brown MC, Turner CE. Paxillin: Adapting to change. Physiol Rev. 2004;84(4):1315–1339. - PubMed

Publication types

MeSH terms