. 2012 May 25:5:258.
doi: 10.1186/1756-0500-5-258.

A systems biology analysis of long and short-term memories of osmotic stress adaptation in fungi

Affiliations

A systems biology analysis of long and short-term memories of osmotic stress adaptation in fungi

Tao You et al. BMC Res Notes. .

Abstract

Background: Saccharomyces cerevisiae senses hyperosmotic conditions via the HOG signaling network that activates the stress-activated protein kinase, Hog1, and modulates metabolic fluxes and gene expression to generate appropriate adaptive responses. The integral control mechanism by which Hog1 modulates glycerol production remains uncharacterized. An additional Hog1-independent mechanism retains intracellular glycerol for adaptation. Candida albicans also adapts to hyperosmolarity via a HOG signaling network. However, it remains unknown whether Hog1 exerts integral or proportional control over glycerol production in C. albicans.

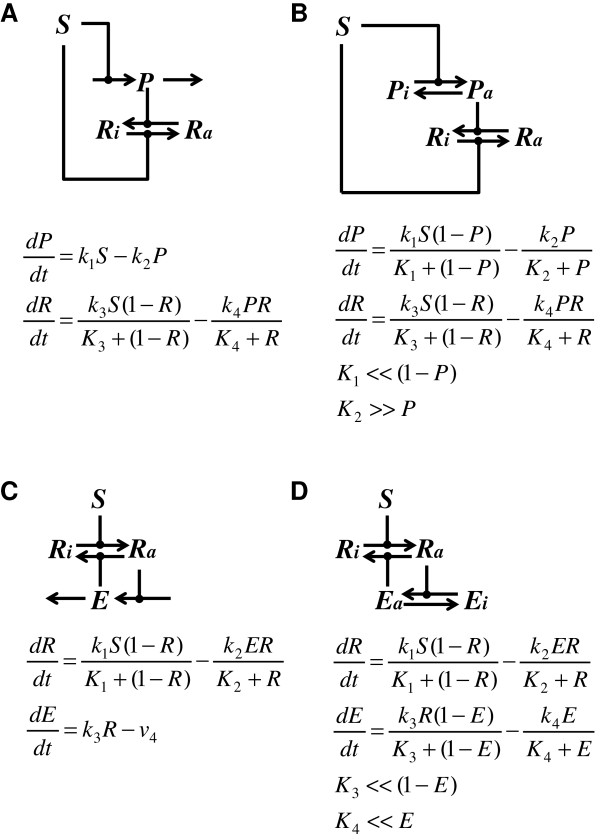
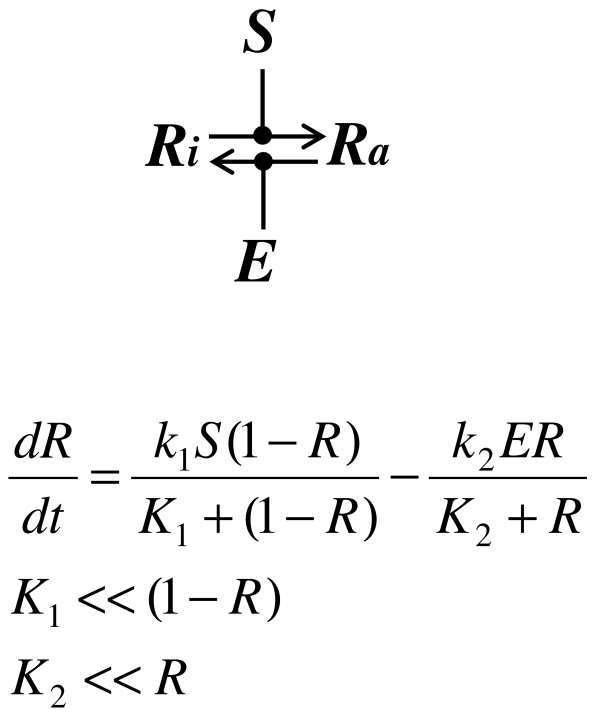
Results: We combined modeling and experimental approaches to study osmotic stress responses in S. cerevisiae and C. albicans. We propose a simple ordinary differential equation (ODE) model that highlights the integral control that Hog1 exerts over glycerol biosynthesis in these species. If integral control arises from a separation of time scales (i.e. rapid HOG activation of glycerol production capacity which decays slowly under hyperosmotic conditions), then the model predicts that glycerol production rates elevate upon adaptation to a first stress and this makes the cell adapts faster to a second hyperosmotic stress. It appears as if the cell is able to remember the stress history that is longer than the timescale of signal transduction. This is termed the long-term stress memory. Our experimental data verify this. Like S. cerevisiae, C. albicans mimimizes glycerol efflux during adaptation to hyperosmolarity. Also, transient activation of intermediate kinases in the HOG pathway results in a short-term memory in the signaling pathway. This determines the amplitude of Hog1 phosphorylation under a periodic sequence of stress and non-stressed intervals. Our model suggests that the long-term memory also affects the way a cell responds to periodic stress conditions. Hence, during osmohomeostasis, short-term memory is dependent upon long-term memory. This is relevant in the context of fungal responses to dynamic and changing environments.

Conclusions: Our experiments and modeling have provided an example of identifying integral control that arises from time-scale separation in different processes, which is an important functional module in various contexts.


Figures

Figure 1
Figure 1
Osmosensing networks. The osmosensing signaling network in S. cerevisiae includes the Sln1 and Sho1 branches which converge at Pbs2 and eventually activate Hog1 by dual phosphorylation [11]. Under normal turgor pressure (i.e. in the absence of hyperosmotic condition), Sln1, a transmembrane protein upstream of the Sln1 branch, is autophosphorylated. This leads to phosphorylation of Ypd1, which subsequently transfers the phosphate group to Ssk1. The phosphorylated form of Ssk1 is unable to activate Ssk2 or Ssk22 via phosphorylation. Under hyperosmotic conditions, autophosphorylation of Sln1 is inhibited. This inactivates Ypd1 and consequently abrogates the inhibition of Ssk1. This is followed by the subsequent activation of the MAPKKK Ssk2 and ultimately of Hog1. Putative osmosensors Hkr1 and Msb2 that lie upstream of the Sho1 branch are postulated to directly sense the extracellular osmolarity [12]. Cdc42 interacts with and activates membrane associated Ste20 or Cla4 [13]. In addition, Cdc42 is able to bind the Ste11-Ste50-Opy2 complex (targeted to the membrane by Opy2) to bring activated Ste20 or Cla4 to their substrate Ste11 [14]. Docked with membrane-bound Sho1, activated Ste11 phosphorylates Pbs2 and eventually activates Hog1. The components of this network that are currently understood in C. albicans are depicted in the dotted box [15].
Figure 2
Figure 2
Networks that enable response (R) to perfectly adapt to signal (S). (A) Incoherent feedforward loop: on one hand, S directly phsophorylates and hence activates R; on the other hand, S inactivates R proportionally via stimulating the expression of proportioner (P) that dephosphorylates R. The activation and inactivation effects cancel out for R in such a loop. As a result, R always resumes to the original state upon adaptation. In the mathematical model, R refers to the phosphorylated form of R (i.e. Ra in the diagram). The first equation dictates that the steady state expression level of P is proportional to S (this is why it is called “proportioner”). Plug this relationship into the second equation and take the steady state: S in the first term will cancel with P in the second term. This makes the steady state of R independent from S. (B) Incoherent feedforward loop. This slightly more complex example also helps demonstrate perfect adaptation. In this case, S phosphorylates and thereby activates both R and P. If S operates in the saturated regime (i.e. K1 < <(1-P)) and the dephosphorylation of P operates in the unsaturated regime (i.e. K2> > P), then the first equation reduces to the same form as that in (A). By the same reasoning, Ra in this incoherent feedforward loop perfects adapts. (C) Negative feedback loop involving time-scale separation: S phosphorylates and activates R that subsequently simulates the expression of its own inhibitor E. In the model, R refers to the phosphorylated form of R (i.e. Ra in the diagram). When E disappears at a constant rate v4, the second equation ensures that the steady state R is independent of S, and is only determined by k3 and v4. In this case, E integrates over R, and this negative feedback loop constitutes an integral controller. As a special case, when the half life of E is much longer than the time scale of other reactions, v4 is approximated to 0. Consequently, R always resumes 0 upon adaptation. (D) Negative feedback loop involving saturated enzyme kinetics: in this slightly more complex scenario, element (E) is the phosphatase of R and is activated by R via phosphorylation. If Ra and E’s phosphatases both operate in their saturated regimes, then the second equation reduces to the same form as that in (C). By the same reasoning, such a negative feedback loop is capable of perfect adaptation.
Figure 3
Figure 3
Block diagram of integral control. For a system, the input signal is u(t), and the output signal is y(t). The difference between u(t) and y(t) is defined as the error signal e(t).
Figure 4
Figure 4
Integral control could result from saturation enzyme kinetics. Here, both kinase and phosphatase operate in the saturated region, the equation governing R reduces to dRdt=k1Sk2E. Therefore, R integrates the difference between S and E.
Figure 5
Figure 5
Overview of the model. The hyperosmotic stress signal is represented as the change in the difference between intracellular and extracellular osmotic pressures (i.e.S(t) = (Πi0 − Πe0) − [Πi(t) − Πe(t)]; Πi0: initial intracellular osmolarity, Πe0: initial extracellular osmolarity, Πi(t): current intracellular osmolarity, Πe(t) current extracellular osmolarity). Thus, the initial signal is equivalent to the increase in osmolarity caused by the extracellular NaCl. Upon an increase in extracellular osmolarity, the signal becomes positive and activates an intermediate kinase (v1) and then Hog1 (v3), both of which are balanced by dephosphorylation activities (v2, and v4 respectively, associated kinetic parameters are constant). Once activated, Hog1 induces the activity of glycerol production machinery (GPM) (v5) which produces glycerol. Intracellular glycerol passively diffuses out of the cell through an aquaglyceroporin (AGP), driven by the concentration gradient across cell membrane (v6). Hyperosmotic shock triggers rapid closure of the aquaglyceroporin to retain glycerol, while a hypoosmotic condition causes the aquaglyceroporin to open to a higher degree than that of the steady-state (v6) and triggers a rapid decrease in the glycerol biosynthesis rate (v7). In both C. albicans and S. cerevisiae, increased intracellular glycerol concentration elevates the intracellular osmotic pressure and eventually attenuates the signal, indicating adaptation to the new condition.
Figure 6
Figure 6
Experimental measurements and model construction. Wild-type S. cerevisiae(A, B) and C. albicans(C-D) cells were exposed to hyperosmotic condtions. (A)S. cerevisiae: 0.2 and 0.5 M NaCl; (B)S. cerevisiae: 1 M NaCl; (C)C. albicans: 0.5 and 1 M NaCl. (D)C. albicans: 1 M NaCl. Hog1 activity, intracellular glycerol and total glycerol were measured in time courses of up to 1 hour. Experimental data for S. cerevisiae in A and B are published results [31]. C. albicans data are from this study. Model predictions were plotted separately from experimental measurements.
Figure 7
Figure 7
Responses ofC. albicansto repeated hyperosmotic stress.C. albicans cells were exposed to two identical hyperosmotic shocks (A: 1 M NaCl; B: 0.5 M NaCl). After adaptation to the first shock (A: 60 min; B: 30 min), the cells were shifted to medium lacking NaCl for 10 min. Subsequently, the cells were subjected to an identical second shock (A: 1 M NaCl, 60 min; B: 0.5 M NaCl, 30 min). Hog1 phosphorylation was measured at various time points over a 1 or 2 h time course in duplicate (A) or triplicate (B). Experimental and simulated Hog1-phosphorylation levels are normalized against the first Hog1 phosphorylation peak. (C) Relative total and intracellular glycerol concentrations (0.5 M NaCl) were measured at various time points over a 2 h time course (2 to 6 replicates were measured up to 60 min, and in duplicate after 60 min). Both experimental and simulation results are normalized to the total glycerol concentration at 60 min.
Figure 8
Figure 8
Simulations of the duration of cellular memory following exposure ofC. albicansto 1 M NaCl. Cells are stressed for 60 min, undergo an interval without stress before a second identical stress is imposed. The interval varies between 2 to 30 min, as indicated in the lower left inset. (A) Hog1 is plotted in relative values. (B) Internal glycerol concentration is in M. (C-D) Extracellular and total glycerol concentration are in mM. (E) Glycerol production rate is in M/min. (F) Stress signal has a dimension of Osm.
Figure 9
Figure 9
Predictions of frequency responses inC. albicans. Responses of a C. albicans cell to a sinusoidal osmotic signal with peak-to-peak amplitude of 1 M NaCl (centered at 0.5 M NaCl) at different frequencies are simulated (dotted line: 0.1 rad/min; dashed line: 1 rad/min; real line: constant stress).
Figure 10
Figure 10
Long-and short-term memories inC. albicans. A cell initially undergoes a constant hyperosmotic shock of 1 M NaCl within the first 60 min. This is followed by the treatment of a 1 rad/min sinusoidal signal with a peak-to-peak amplitude of 1 M NaCl centered at 0.5 M NaCl.

Similar articles

Cited by

References

    1. Maeda T, Wurgler-Murphy SM, Saito H. A two-component system that regulates an osmosensing MAP kinase cascade in yeast. Nature. 1994;369:242–245. doi: 10.1038/369242a0. - DOI - PubMed
    1. Posas F, Wurgler-Murphy SM, Maeda T, Witten EA, Thai TC, Saito H. YeastHOG1MAP kinase cascade is regulated by a multistep phosphorelay mechanism in the SLN1-YPD1-SSK1 “two-component” osmosensor. Cell. 1996;86:865–875. doi: 10.1016/S0092-8674(00)80162-2. - DOI - PubMed
    1. Maeda T, Takekawa M, Saito H. Activation of yeast PBS2 MAPKK by MAPKKKs or by binding of an SH3-containing osmosensor. Science. 1995;269:554–558. doi: 10.1126/science.7624781. - DOI - PubMed
    1. Posas F, Saito H. Osmotic activation of the HOG MAP kinase pathway via Ste11p MAPKKK: scaffold role of Pbs2p MAPKK. Science. 1997;276:1702–1705. doi: 10.1126/science.276.5319.1702. - DOI - PubMed
    1. Hohmann S. Osmotic stress signaling and osmoadaptation in Yeasts. Microbiol Mol Biol Rev. 2002;66:300–372. doi: 10.1128/MMBR.66.2.300-372.2002. - DOI - PMC - PubMed

Publication types

Substances

LinkOut - more resources