. 2012 Jul 4;134(26):10833-42.
doi: 10.1021/ja300374c. Epub 2012 Jun 14.

Monitoring lipid anchor organization in cell membranes by PIE-FCCS

Affiliations
Free PMC article

Monitoring lipid anchor organization in cell membranes by PIE-FCCS

Sara B Triffo et al. J Am Chem Soc. .
Free PMC article

Abstract

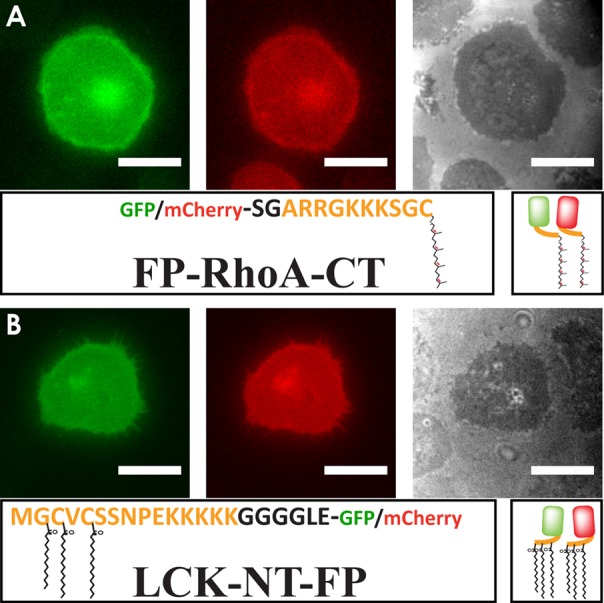
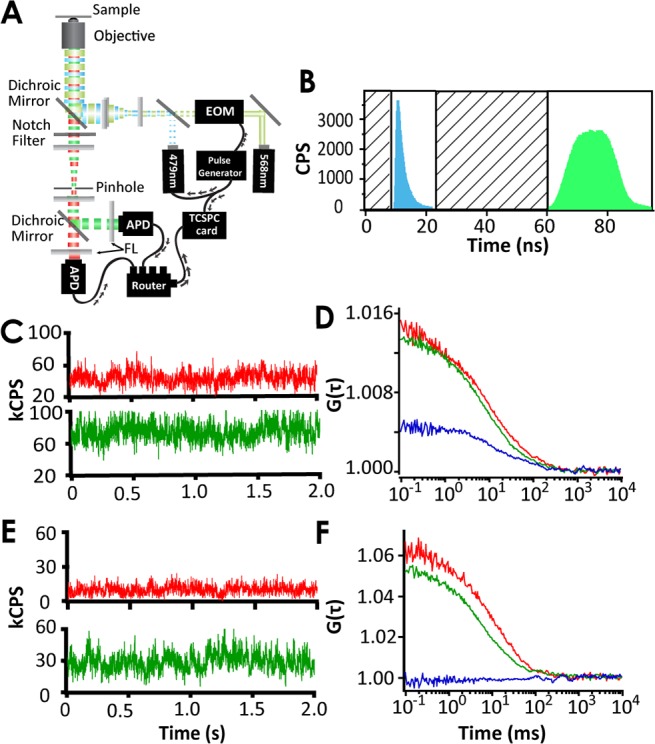
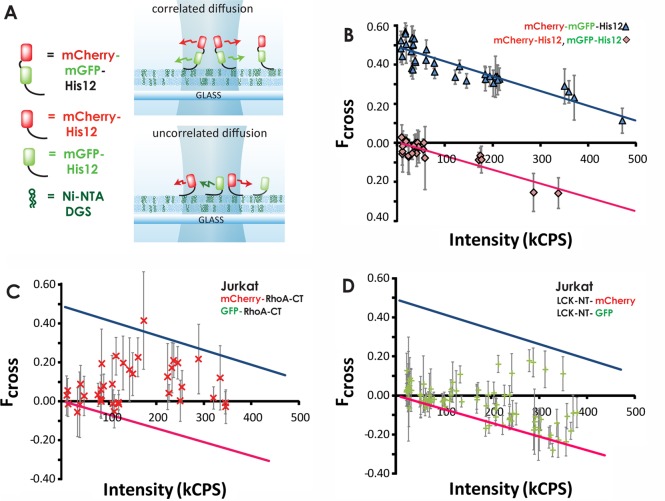
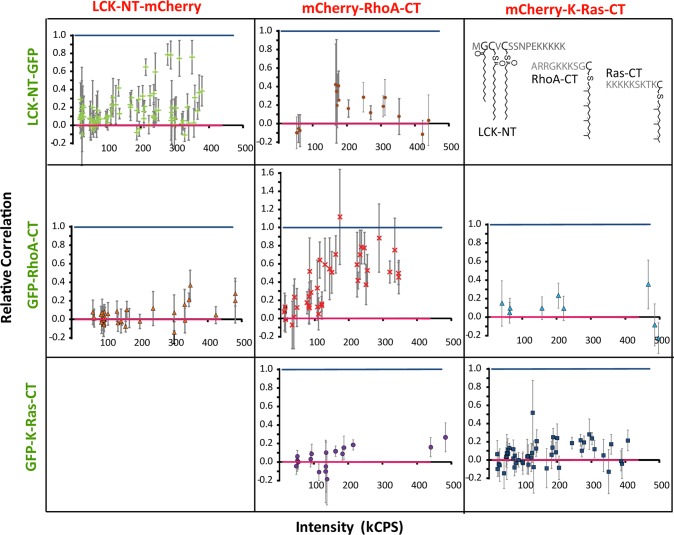
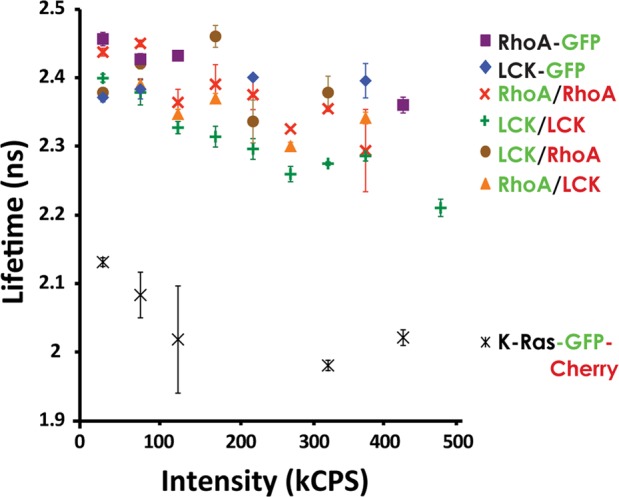
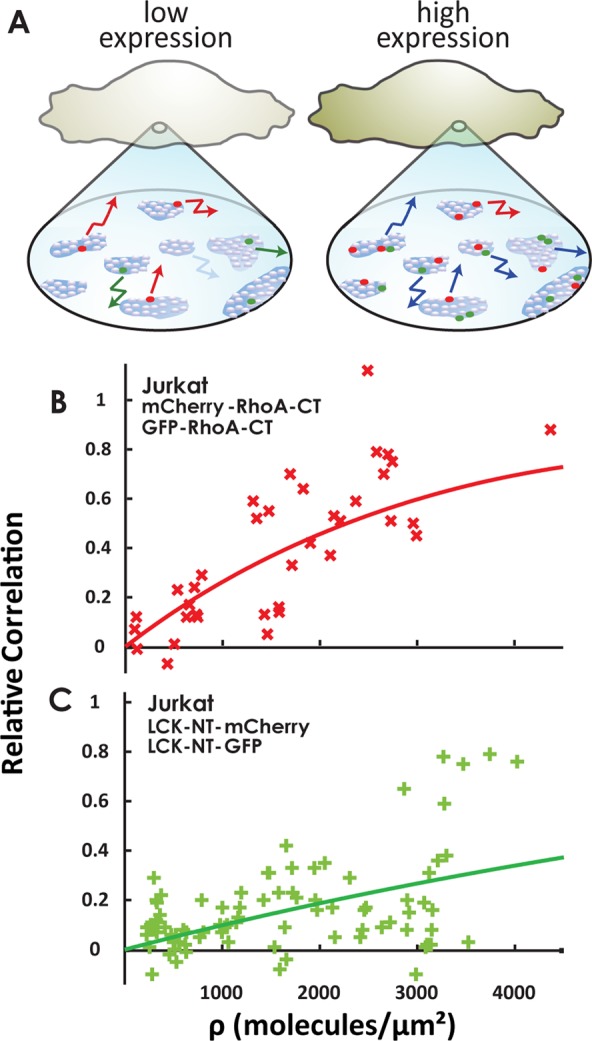
This study examines the dynamic co-localization of lipid-anchored fluorescent proteins in living cells using pulsed-interleaved excitation fluorescence cross-correlation spectroscopy (PIE-FCCS) and fluorescence lifetime analysis. Specifically, we look at the pairwise co-localization of anchors from lymphocyte cell kinase (LCK: myristoyl, palmitoyl, palmitoyl), RhoA (geranylgeranyl), and K-Ras (farnesyl) proteins in different cell types. In Jurkat cells, a density-dependent increase in cross-correlation among RhoA anchors is observed, while LCK anchors exhibit a more moderate increase and broader distribution. No correlation was detected among K-Ras anchors or between any of the different anchor types studied. Fluorescence lifetime data reveal no significant Förster resonance energy transfer in any of the data. In COS 7 cells, minimal correlation was detected among LCK or RhoA anchors. Taken together, these observations suggest that some lipid anchors take part in anchor-specific co-clustering with other existing clusters of native proteins and lipids in the membrane. Importantly, these observations do not support a simple interpretation of lipid anchor-mediated organization driven by partitioning based on binary lipid phase separation.


Figures

Figure 1
Figure 1
Green, red epi-fluorescent, and reflection interference contrast microscopy (RICM) images of Jurkat cells expressing (A) EGFP-RhoA-CT and mCherry-RhoA-CT and (B) LCK-NT-EGFP and LCK-NT-mCherry. Anchored fluorescent proteins are localized to the plasma membrane, and bright masses are due to intracellular organelles. RICM shows that cell membranes are well adhered to P-L-L-coated coverslips. Images are false-colored, and the scale bar is 10 μm. Cartoons detailing the lipid moiety and peptide sequence fused to EGFP or mCherry are shown below the images.
Figure 2
Figure 2
(A) Schematic of our PIE-FCCS microscope setup. (B) Arrival time (time-resolved) histogram of APD A (green) and APD B (cyan). Photons with arrival times within the diagonal lined boxes are removed before auto- and cross-correlation curves are calculated. (C) Intensity traces from APD A (red) and APD B (green) resulting from detected fluorescence from a bilayer sample with mCherry-mGFP-His12 exhibiting correlated diffusion. (D) Auto- (red and green) and cross-correlation curves (blue) calculated from the intensity traces in (C). (E) Intensity traces from a bilayer sample with mCherry-His12 and mGFP-His12 exhibiting uncorrelated diffusion. (F) Auto- and cross-correlation curves calculated from traces in (E).
Figure 3
Figure 3
(A) Schematic of mCherry-mGFP-His12 diffusing on a Ni-NTA-DGS-containing supported lipid bilayer representing the correlated state (top) and mCherry-His12 and mGFP-His12 diffusing independently on a supported lipid bilayer representing the uncorrelated state (bottom). (B) Scatter plot of Fcross versus intensity of correlated mCherry-mGFP-His12 (blue ▲) and uncorrelated mCherry-His12 and mGFP-His12 (pink ◆). Increased intensity comes from increased surface density of His-tagged fluorescent proteins. Decreasing cross-correlation with respect to intensity is due to TCSPC card dead time and is fit to a linear trend. (C,D) EGFP-RhoA-CT/mCherry-RhoA-CT cross-correlation (red ×) and LCK-NT-EGFP/LCK-NT-mCherry cross-correlation (green +) with respect to increasing intensity in Jurkat cells. Blue and magenta lines represent the linear fits of the empirically mapped cross-correlation states from (B). Error bars represent the standard deviation of G(0) at each spot.
Figure 4
Figure 4
Normalizing cross-correlation to the empirically mapped correlated (1, blue) and uncorrelated (0, magenta) states for (top row, left to right) LCK-NT-EGFP/LCK-NT-mCherry (N = 87, 28 cells) (green +) and LCK-NT-EGFP/mCherry-RhoA-CT (N = 17, 5 cells) (brown ●), (middle row, left to right) EGFP-RhoA-CT/LCK-NT-mCherry (N = 36, 11 cells) (orange ▲), EGFP-RhoA-CT/mCherry-RhoA-CT (N = 37, 11 cells) (red ×), and EGFP-RhoA-CT/mCherry-K-Ras-CT (N = 9, 3 cells) (blue ▲), and (bottom row, left to right) EGFP-K-Ras-CT/mCherry-RhoA-CT (N = 17, 5 cells) (purple ●) and EGFP-K-Ras-CT/mCherry-K-Ras-CT (N = 49, 13 cells) (blue ■) in Jurkat T cells. Error bars represent the normalized standard deviation of G(0) for each spot.
Figure 5
Figure 5
Fluorescence lifetimes were fit, and the fitted lifetimes were binned into 50 kCPS bins. The error bars represent the standard error of all points in each bin. Cells transfected with anchored GFP and anchored mCherry show the same decreasing trend with increasing intensity as cells transfected with only anchored GFP (LCK-NT-EGFP and EGFP-RhoA-CT). The difference in lifetime of the GFP when fused to mCherry in the single polypeptide mGFP-mCherry-K-Ras-CT, which we expect to undergo FRET, and that of the GFP in all other samples, shows that none of the other anchored GFPs undergo significant energy transfer.
Figure 6
Figure 6
(A) Our model of RhoA-anchored fluorescent proteins sorting into pre-existing clusters based on a minimum density requirement before observing cross-correlation. (B,C) Relative cross-correlation of (B) mCherry-RhoA-CT/EGFP-RhoA-CT and (C) LCK-NT-mCherry/LCK-NT-EGFP with respect to the total surface density of anchored fluoroscent proteins in Jurkat cell membranes. A probablistic model (shown as a solid line) is fit to the distribution of relative correlation values to return the average number of clusters for each anchor type in the cell membranes, 1640 clusters/μm2 (R2 = 0.593) and 4820 clusters/μm2 (R2 = 0.2358) for (B) and (C), respectively.

Similar articles

Cited by

References

    1. Bhatnagar R. S.; Gordon J. I. Trends Cell Biol. 1997, 7, 14. - PubMed
    1. Engelman D. M. Nature 2005, 438, 578. - PubMed
    1. Resh M. D. Nat. Chem. Biol. 2006, 2, 584. - PubMed
    1. Zacharias D. A.; Violin J. D.; Newton A. C.; Tsien R. Y. Science 2002, 296, 913. - PubMed
    1. Levental I.; Lingwood D.; Grzybek M.; Coskun Ü.; Simons K. Proc. Natl. Acad. Sci. U.S.A. 2010, 107, 22050. - PMC - PubMed

Publication types

MeSH terms

Substances