

doi: 10.1016/j.neuron.2012.05.001.
Data visualization in the neurosciences: overcoming the curse of dimensionality
Affiliations
- PMID: 22632718
- PMCID: PMC4427844
- DOI: 10.1016/j.neuron.2012.05.001
Item in Clipboard
Data visualization in the neurosciences: overcoming the curse of dimensionality
Neuron.
.
Abstract
In publications, presentations, and popular media, scientific results are predominantly communicated through graphs. But are these figures clear and honest or misleading? We examine current practices in data visualization and discuss improvements, advocating design choices which reveal data rather than hide it.
Copyright © 2012 Elsevier Inc. All rights reserved.
Figures

(A) Definitions and examples of graphical features for 2D (left) and 3D (right) datasets. (B) Mean proportion of 2D (white) and 3D (dark gray) figures displaying each feature. Error bars denote 95% non-parametric confidence intervals (10,000 resamples). (C) Mean proportion of 2D figures indicating uncertainty, separated by categorical (white) and continuous data (light gray). Left panel considers all figures; right panel considers only figures with both categorical and continuous data.
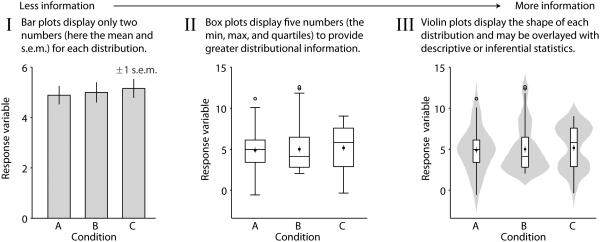
The same synthetic data is summarized in a bar plot (I), box plot (II), and violin plot (III). Box plots in (II) and (III) also show the mean ± s.e.m. and are drawn with a maximum whisker length of 1.5 times the interquartile range. Data points (n=50 for each condition) were sampled from a normal distribution (condition A), a generalized χ2 distribution with 2 degrees of freedom (B), and an equal mixture of two normal distributions with different means (C).

Captions describe panel II. (A) EEG flanker data. ERPs for error trials (red) and correct trials (blue) averaged over 10 subjects. Error bands are 95% non-parametric CIs (1000 bootstraps). Asterisks indicate significantly different ERPs at P<0.001 (nonparametric randomization test, 10,000 randomizations, implicit correction for multiple comparisons). (B) FMRI auditory oddball data. Axial slices show the difference between novel and standard beta weights averaged over 28 subjects. Beta difference is mapped to color hue; t-statistic magnitude is mapped to transparency. Contours denote significantly different betas at P<0.001 (two-tailed paired t-tests corrected with false discovery rate). (B1,B2) Scatter plots of standard versus novel betas for select regions. Beta weights are averaged over clusters of contiguous voxels passing significance (B1=2426 voxels; B2=1733 voxels). Dotted lines indicate y=x.
References
-
- Buckner RL, Andrews-Hanna JR, Schacter DL. The brain's default network: Anatomy, function, and relevance to disease. Annals of the New York Academy of Sciences. 2008;1124:1–38. - PubMed
-
- Cleveland WS. Graphs in scientific publications. American Statistician. 1984;38:261–269.
-
- Cleveland WS, McGill R. Graphical perception and graphical methods for analyzing scientific data. Science. 1985;229:828–833. - PubMed
-
- Cumming G, Finch S. Inference by eye: confidence intervals and how to read pictures of data. American Psychologist. 2005;60:170–180. - PubMed
MeSH terms
Grants and funding
LinkOut - more resources
Full Text Sources
Other Literature Sources
Medical
