

BAD-dependent regulation of fuel metabolism and K(ATP) channel activity confers resistance to epileptic seizures
- PMID: 22632729
- PMCID: PMC3361694
- DOI: 10.1016/j.neuron.2012.03.032
BAD-dependent regulation of fuel metabolism and K(ATP) channel activity confers resistance to epileptic seizures
Abstract
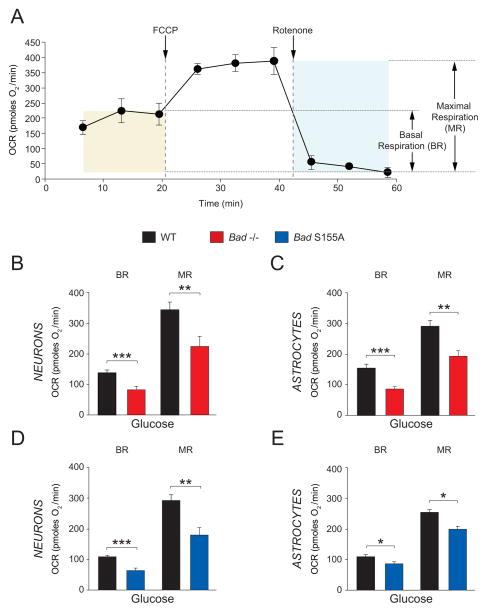
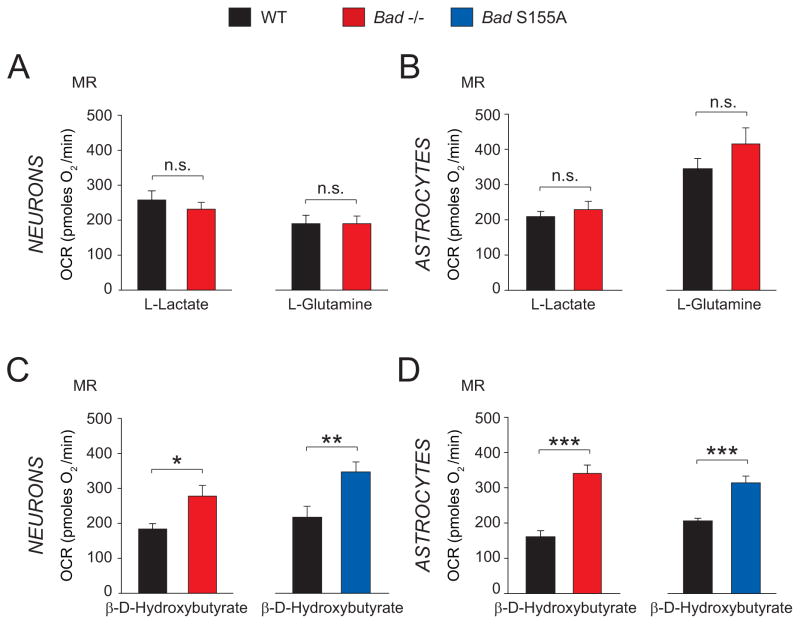
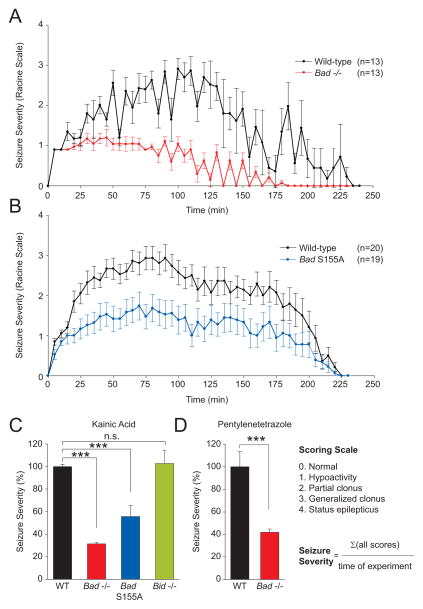
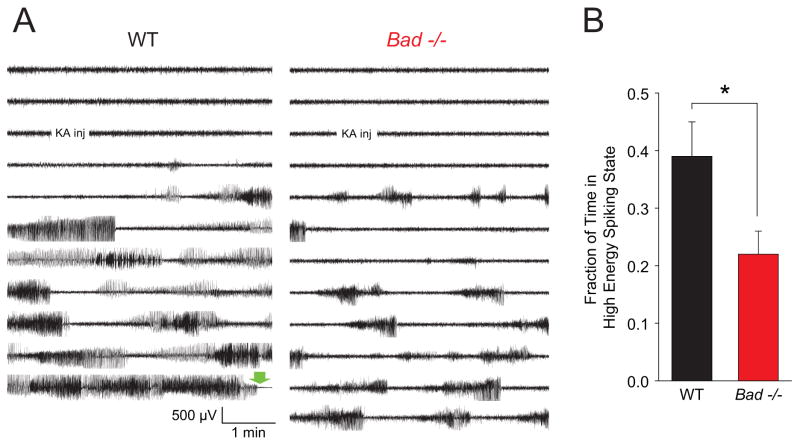
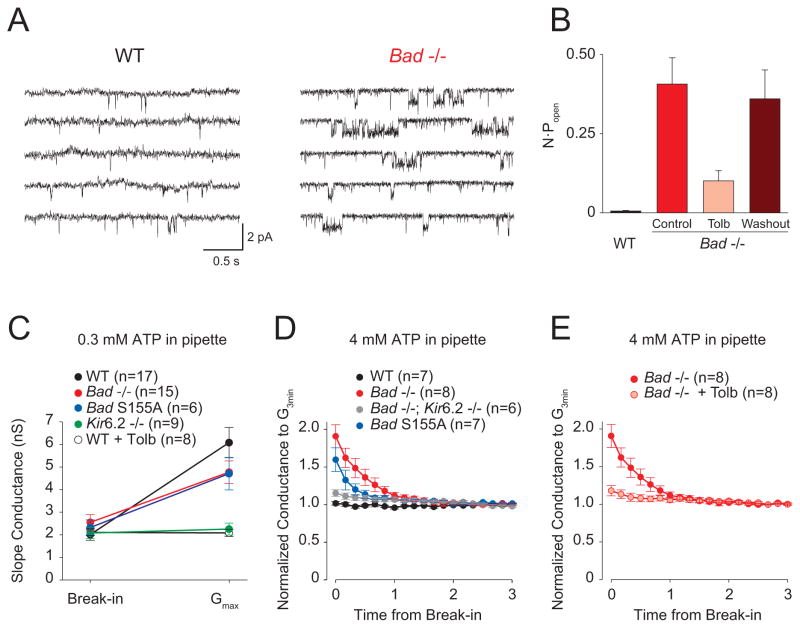
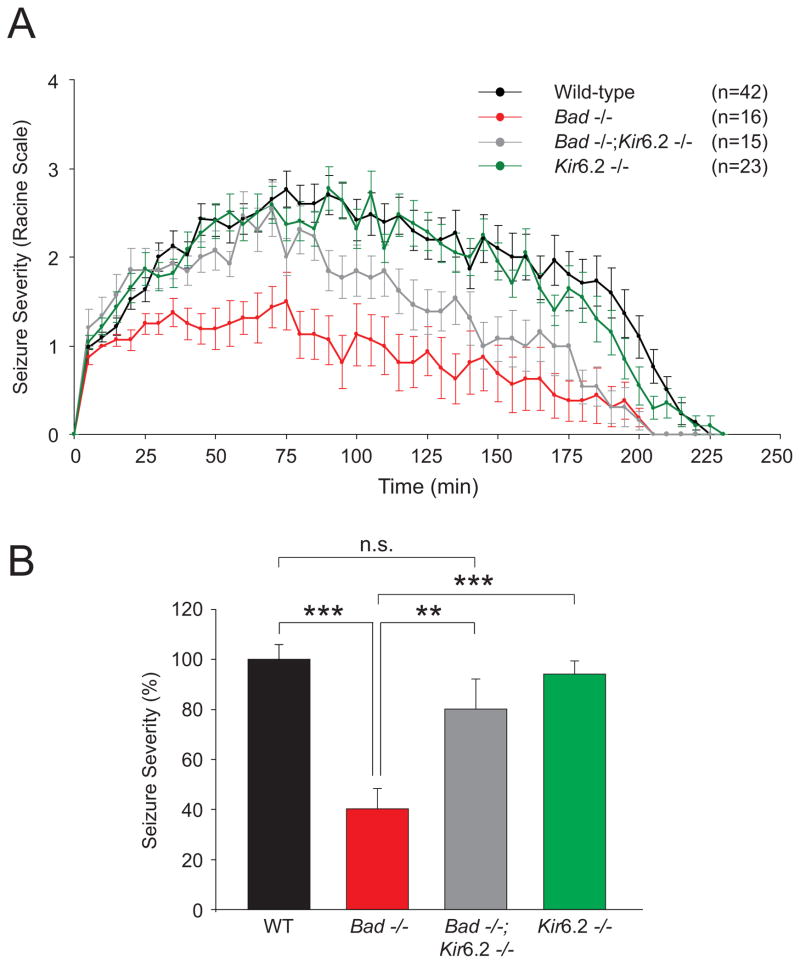
Neuronal excitation can be substantially modulated by alterations in metabolism, as evident from the anticonvulsant effect of diets that reduce glucose utilization and promote ketone body metabolism. We provide genetic evidence that BAD, a protein with dual functions in apoptosis and glucose metabolism, imparts reciprocal effects on metabolism of glucose and ketone bodies in brain cells. These effects involve phosphoregulation of BAD and are independent of its apoptotic function. BAD modifications that reduce glucose metabolism produce a marked increase in the activity of metabolically sensitive K(ATP) channels in neurons, as well as resistance to behavioral and electrographic seizures in vivo. Seizure resistance is reversed by genetic ablation of the K(ATP) channel, implicating the BAD-K(ATP) axis in metabolic control of neuronal excitation and seizure responses.
Copyright © 2012 Elsevier Inc. All rights reserved.
Figures
Comment in
-
In epilepsy, BAD is not really bad.Neuron. 2012 May 24;74(4):600-2. doi: 10.1016/j.neuron.2012.05.003. Neuron. 2012. PMID: 22632717
Similar articles
-
BAD and KATP channels regulate neuron excitability and epileptiform activity.Elife. 2018 Jan 25;7:e32721. doi: 10.7554/eLife.32721. Elife. 2018. PMID: 29368690 Free PMC article.
-
The metabolic impact of β-hydroxybutyrate on neurotransmission: Reduced glycolysis mediates changes in calcium responses and KATP channel receptor sensitivity.J Neurochem. 2015 Mar;132(5):520-31. doi: 10.1111/jnc.12975. Epub 2015 Jan 13. J Neurochem. 2015. PMID: 25330271
-
Activation of Bcl-2-associated death protein and counter-response of Akt within cell populations during seizure-induced neuronal death.J Neurosci. 2002 Oct 1;22(19):8458-65. doi: 10.1523/JNEUROSCI.22-19-08458.2002. J Neurosci. 2002. PMID: 12351720 Free PMC article.
-
BAD: undertaker by night, candyman by day.Oncogene. 2008 Dec;27 Suppl 1:S53-70. doi: 10.1038/onc.2009.44. Oncogene. 2008. PMID: 19641507 Review.
-
Mitochondrial dysfunction and seizures: the neuronal energy crisis.Lancet Neurol. 2015 Sep;14(9):956-66. doi: 10.1016/S1474-4422(15)00148-9. Lancet Neurol. 2015. PMID: 26293567 Review.
Cited by
-
Ketogenic diet improves core symptoms of autism in BTBR mice.PLoS One. 2013 Jun 5;8(6):e65021. doi: 10.1371/journal.pone.0065021. Print 2013. PLoS One. 2013. PMID: 23755170 Free PMC article.
-
Altered Glycolysis and Mitochondrial Respiration in a Zebrafish Model of Dravet Syndrome.eNeuro. 2016 Apr 5;3(2):ENEURO.0008-16.2016. doi: 10.1523/ENEURO.0008-16.2016. eCollection 2016 Mar-Apr. eNeuro. 2016. PMID: 27066534 Free PMC article.
-
Leucine-Enriched Essential Amino Acids Enhance the Antiseizure Effects of the Ketogenic Diet in Rats.Front Neurosci. 2021 Mar 19;15:637288. doi: 10.3389/fnins.2021.637288. eCollection 2021. Front Neurosci. 2021. PMID: 33815043 Free PMC article.
-
Multiple functions of BCL-2 family proteins.Cold Spring Harb Perspect Biol. 2013 Feb 1;5(2):a008722. doi: 10.1101/cshperspect.a008722. Cold Spring Harb Perspect Biol. 2013. PMID: 23378584 Free PMC article. Review.
-
Mitochondrial ATP-Mg/Pi carrier SCaMC-3/Slc25a23 counteracts PARP-1-dependent fall in mitochondrial ATP caused by excitotoxic insults in neurons.J Neurosci. 2015 Feb 25;35(8):3566-81. doi: 10.1523/JNEUROSCI.2702-14.2015. J Neurosci. 2015. PMID: 25716855 Free PMC article.
References
-
- Banker G, Goslin K. Culturing nerve cells. 2. Cambridge, Mass: MIT Press; 1998.
-
- Ben-Ari Y, Tremblay E, Ottersen OP, Meldrum BS. The role of epileptic activity in hippocampal and “remote” cerebral lesions induced by kainic acid. Brain Res. 1980;191:79–97. - PubMed
-
- Bough KJ, Eagles DA. A ketogenic diet increases the resistance to pentylenetetrazole-induced seizures in the rat. Epilepsia. 1999;40:138–143. - PubMed
-
- Brenner R, Chen QH, Vilaythong A, Toney GM, Noebels JL, Aldrich RW. BK channel beta4 subunit reduces dentate gyrus excitability and protects against temporal lobe seizures. Nat Neurosci. 2005;8:1752–1759. - PubMed
Publication types
MeSH terms
Substances
Grants and funding
LinkOut - more resources
Full Text Sources
Medical
Molecular Biology Databases
Research Materials
