

Anatomy of the visual word form area: adjacent cortical circuits and long-range white matter connections
- PMID: 22632810
- PMCID: PMC3432298
- DOI: 10.1016/j.bandl.2012.04.010
Anatomy of the visual word form area: adjacent cortical circuits and long-range white matter connections
Abstract
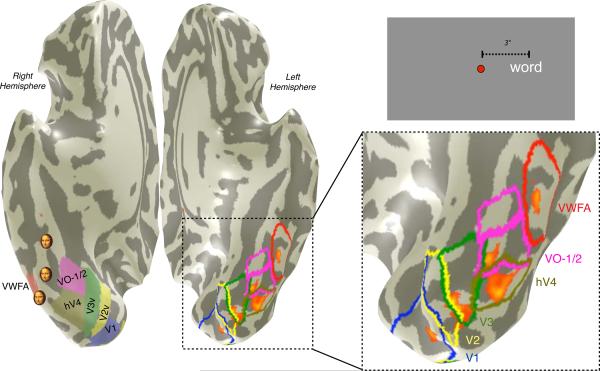
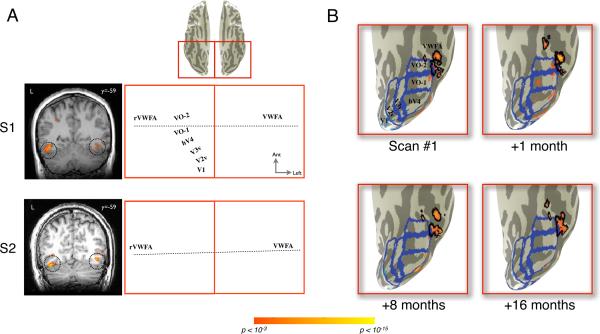
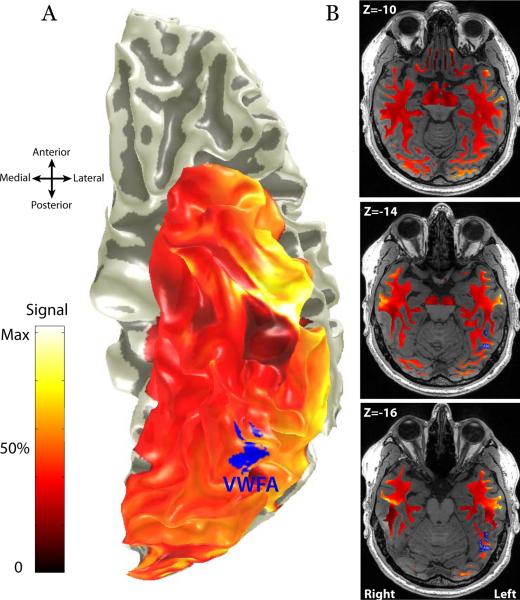
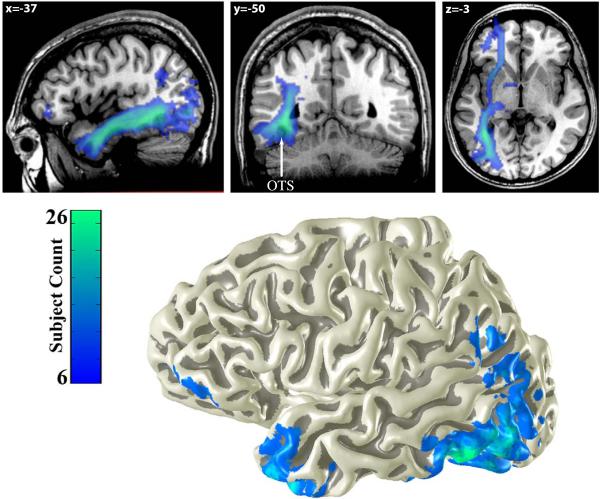
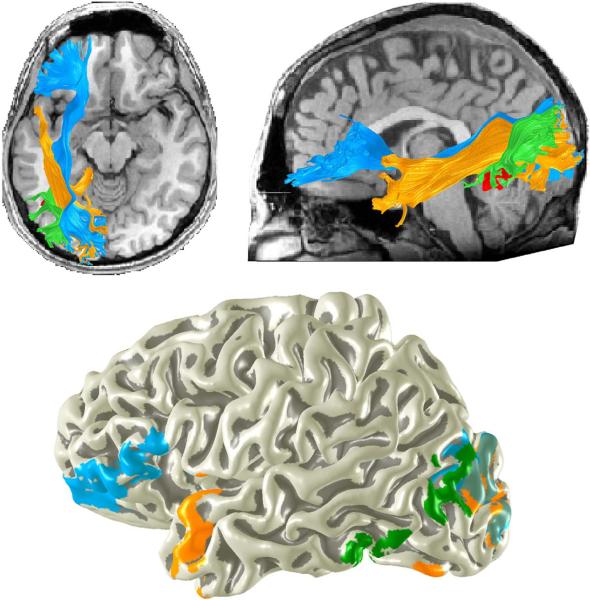
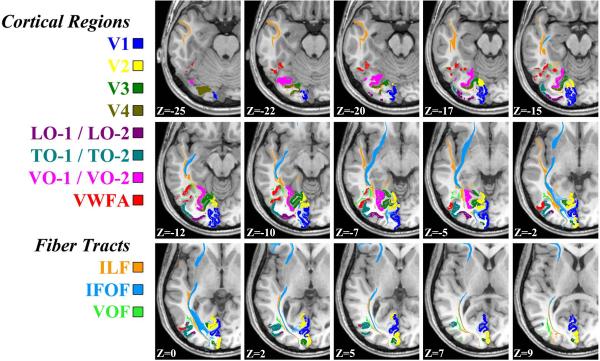
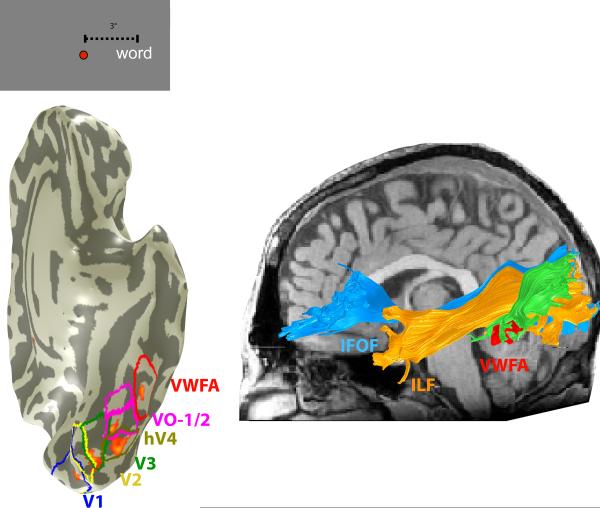
Circuitry in ventral occipital-temporal cortex is essential for seeing words. We analyze the circuitry within a specific ventral-occipital region, the visual word form area (VWFA). The VWFA is immediately adjacent to the retinotopically organized VO-1 and VO-2 visual field maps and lies medial and inferior to visual field maps within motion selective human cortex. Three distinct white matter fascicles pass within close proximity to the VWFA: (1) the inferior longitudinal fasciculus, (2) the inferior frontal occipital fasciculus, and (3) the vertical occipital fasciculus. The vertical occipital fasciculus terminates in or adjacent to the functionally defined VWFA voxels in every individual. The vertical occipital fasciculus projects dorsally to language and reading related cortex. The combination of functional responses from cortex and anatomical measures in the white matter provides an overview of how the written word is encoded and communicated along the ventral occipital-temporal circuitry for seeing words.
Copyright © 2012 Elsevier Inc. All rights reserved.
Figures
Similar articles
-
Connectivity between the visual word form area and the parietal lobe improves after the first year of reading instruction: a longitudinal MRI study in children.Brain Struct Funct. 2019 May;224(4):1519-1536. doi: 10.1007/s00429-019-01855-3. Epub 2019 Mar 6. Brain Struct Funct. 2019. PMID: 30840149
-
Emergence of a compositional neural code for written words: Recycling of a convolutional neural network for reading.Proc Natl Acad Sci U S A. 2021 Nov 16;118(46):e2104779118. doi: 10.1073/pnas.2104779118. Proc Natl Acad Sci U S A. 2021. PMID: 34750255 Free PMC article.
-
White matter fascicles and cortical microstructure predict reading-related responses in human ventral temporal cortex.Neuroimage. 2021 Feb 15;227:117669. doi: 10.1016/j.neuroimage.2020.117669. Epub 2020 Dec 24. Neuroimage. 2021. PMID: 33359351 Free PMC article.
-
Origins of the specialization for letters and numbers in ventral occipitotemporal cortex.Trends Cogn Sci. 2015 Jul;19(7):374-82. doi: 10.1016/j.tics.2015.05.006. Epub 2015 Jun 11. Trends Cogn Sci. 2015. PMID: 26072689 Review.
-
The inferior fronto-occipital fasciculus: bridging phylogeny, ontogeny and functional anatomy.Brain. 2025 May 13;148(5):1507-1525. doi: 10.1093/brain/awaf055. Brain. 2025. PMID: 39932875 Free PMC article. Review.
Cited by
-
Tract profiles of white matter properties: automating fiber-tract quantification.PLoS One. 2012;7(11):e49790. doi: 10.1371/journal.pone.0049790. Epub 2012 Nov 14. PLoS One. 2012. PMID: 23166771 Free PMC article.
-
Structure, asymmetry, and connectivity of the human temporo-parietal aslant and vertical occipital fasciculi.Brain Struct Funct. 2019 Mar;224(2):907-923. doi: 10.1007/s00429-018-1812-0. Epub 2018 Dec 12. Brain Struct Funct. 2019. PMID: 30542766 Free PMC article.
-
A mesial-to-lateral dissociation for orthographic processing in the visual cortex.Proc Natl Acad Sci U S A. 2019 Oct 22;116(43):21936-21946. doi: 10.1073/pnas.1904184116. Epub 2019 Oct 7. Proc Natl Acad Sci U S A. 2019. PMID: 31591198 Free PMC article.
-
Structural connectivity patterns associated with the putative visual word form area and children's reading ability.Brain Res. 2014 Oct 24;1586:118-29. doi: 10.1016/j.brainres.2014.08.050. Epub 2014 Aug 22. Brain Res. 2014. PMID: 25152466 Free PMC article.
-
Bottom-up and top-down computations in word- and face-selective cortex.Elife. 2017 Feb 22;6:e22341. doi: 10.7554/eLife.22341. Elife. 2017. PMID: 28226243 Free PMC article.
References
-
- Basser PJ, Pajevic S, Pierpaoli C, Duda J, Aldroubi A. In vivo fiber tractography using DT-MRI data. Magnetic Resonance in Medicine. 2000;44(4):625–632. - PubMed
-
- Beauchamp MS, Cox RW, DeYoe EA. Graded effects of spatial and featural attention on human area MT and associated motion processing areas. J Neurophysiol. 1997;78(1):516–520. - PubMed
Publication types
MeSH terms
Grants and funding
LinkOut - more resources
Full Text Sources
Other Literature Sources
