. 2012 May 25;149(5):1060-72.
doi: 10.1016/j.cell.2012.03.042.

Ferroptosis: an iron-dependent form of nonapoptotic cell death

Affiliations

Ferroptosis: an iron-dependent form of nonapoptotic cell death

Scott J Dixon et al. Cell. .

Abstract

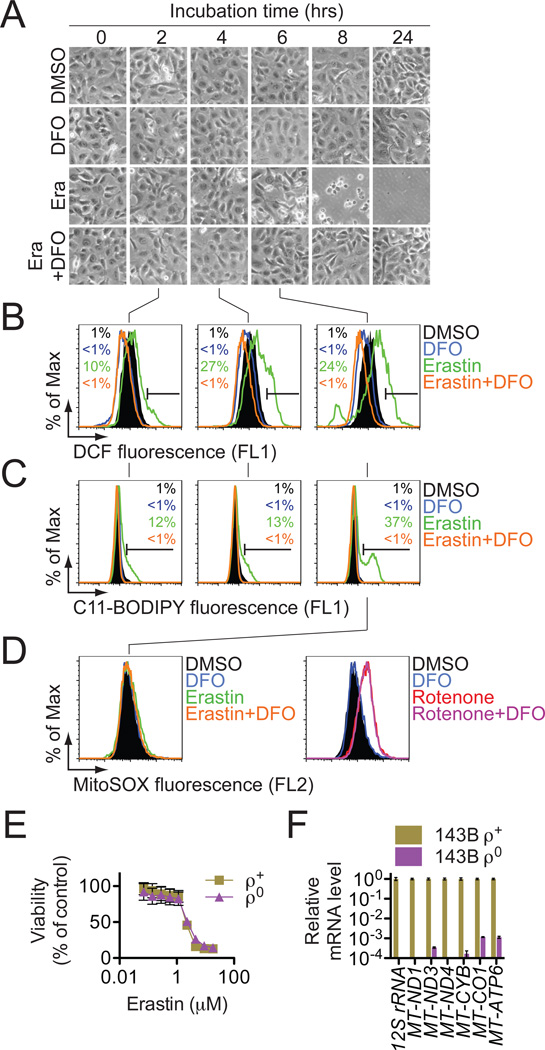
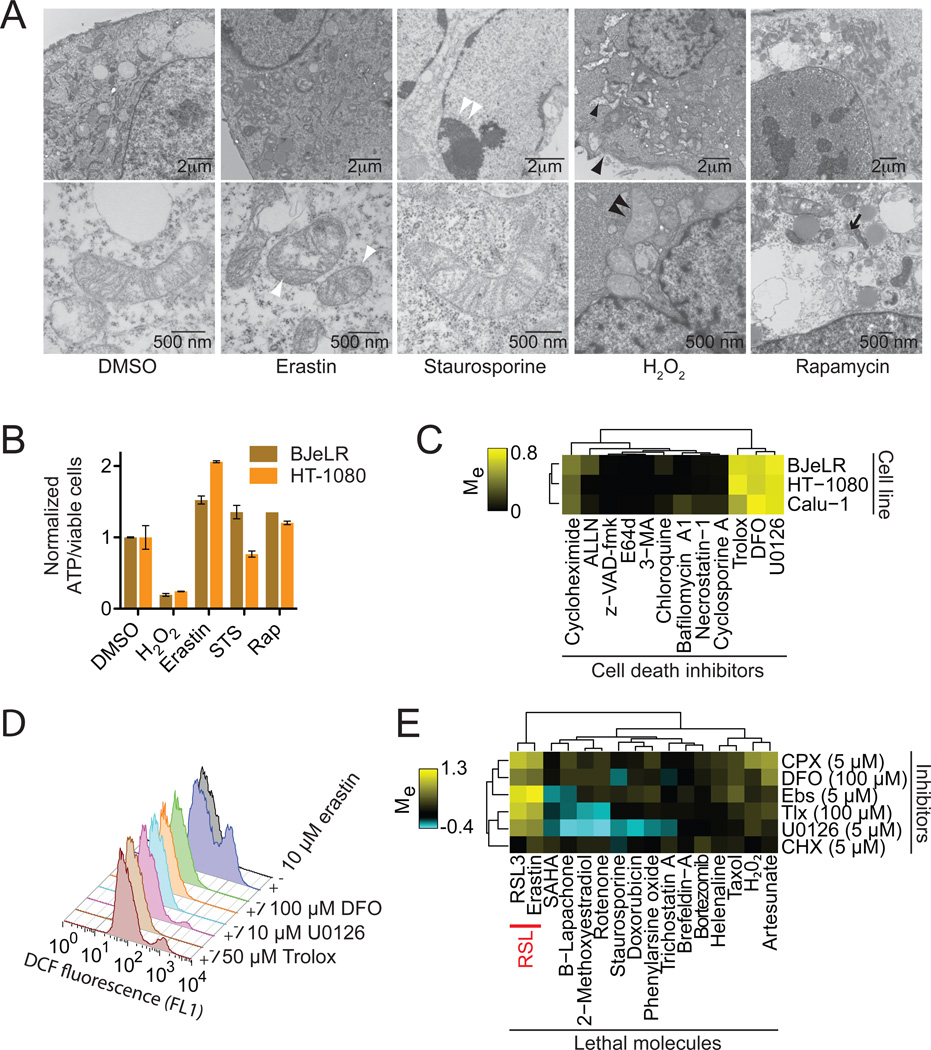
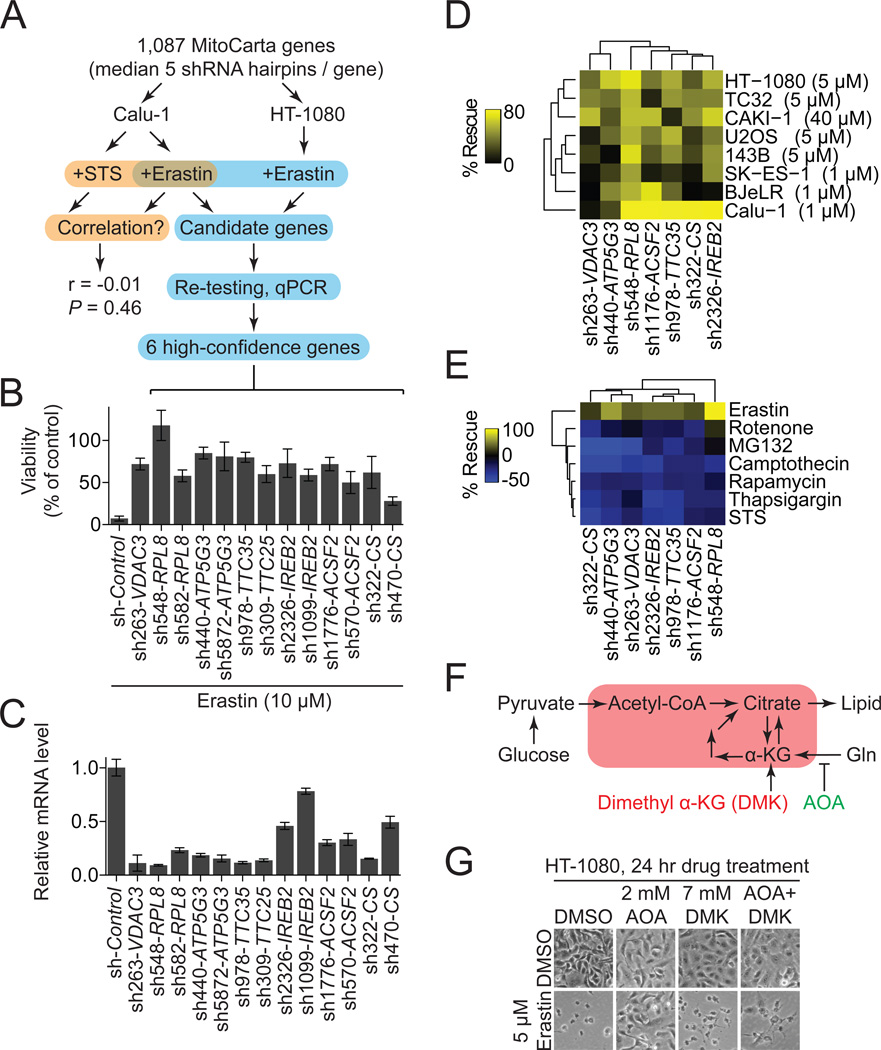
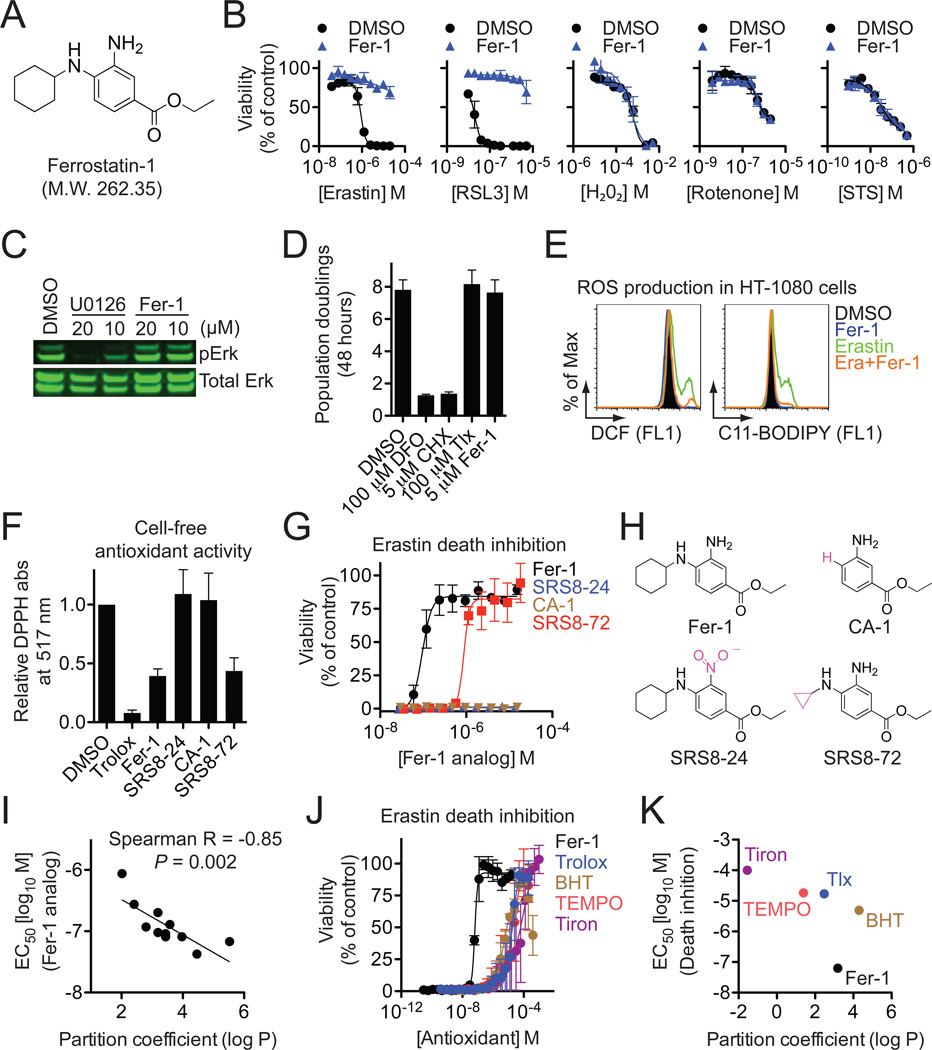
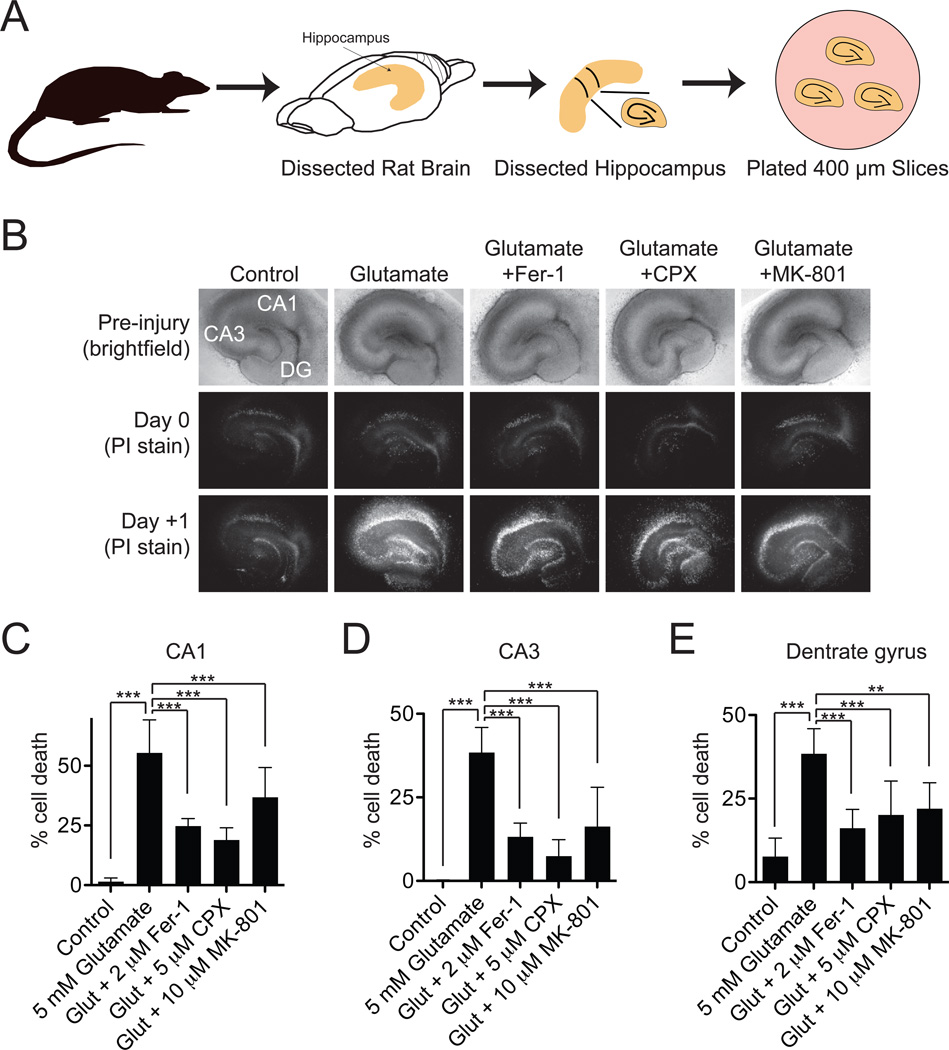
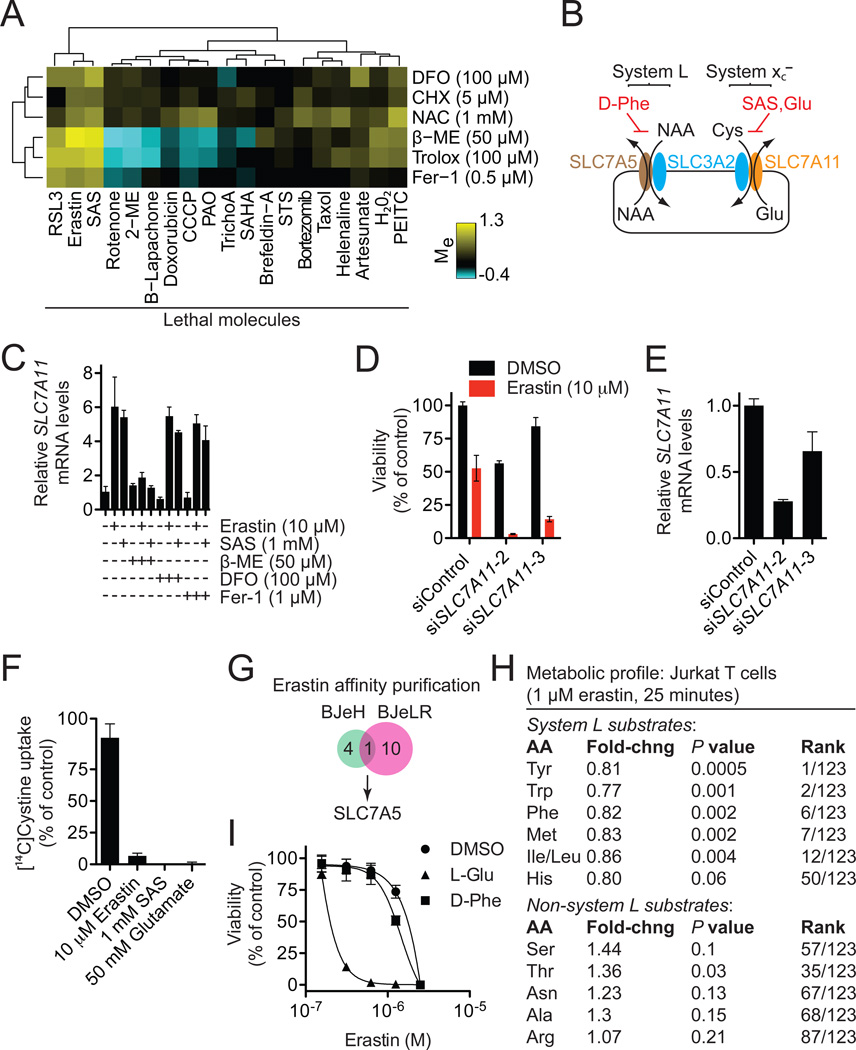
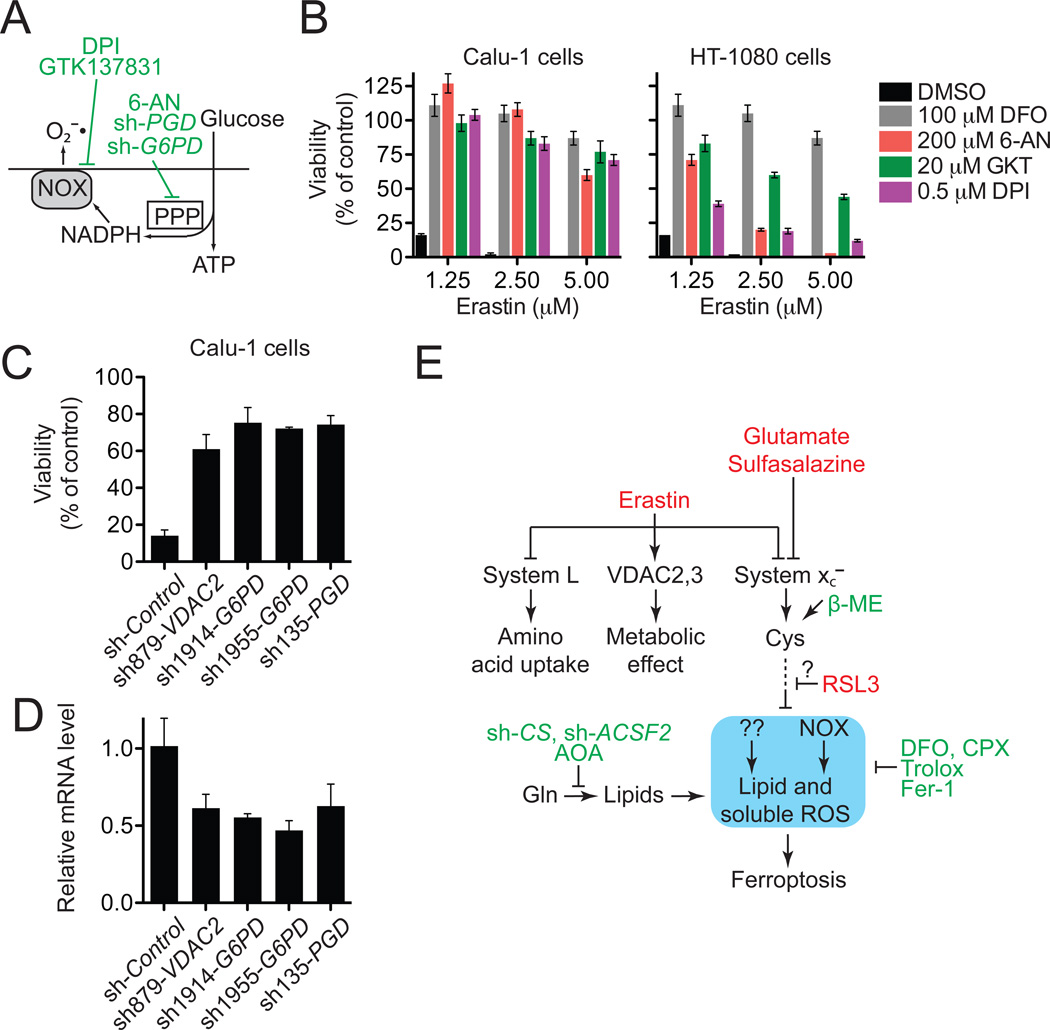
Nonapoptotic forms of cell death may facilitate the selective elimination of some tumor cells or be activated in specific pathological states. The oncogenic RAS-selective lethal small molecule erastin triggers a unique iron-dependent form of nonapoptotic cell death that we term ferroptosis. Ferroptosis is dependent upon intracellular iron, but not other metals, and is morphologically, biochemically, and genetically distinct from apoptosis, necrosis, and autophagy. We identify the small molecule ferrostatin-1 as a potent inhibitor of ferroptosis in cancer cells and glutamate-induced cell death in organotypic rat brain slices, suggesting similarities between these two processes. Indeed, erastin, like glutamate, inhibits cystine uptake by the cystine/glutamate antiporter (system x(c)(-)), creating a void in the antioxidant defenses of the cell and ultimately leading to iron-dependent, oxidative death. Thus, activation of ferroptosis results in the nonapoptotic destruction of certain cancer cells, whereas inhibition of this process may protect organisms from neurodegeneration.


Figures

Figure 1
Figure 1. Erastin-induced death triggers the accumulation of cytosolic ROS whose production can be inhibited by DFO
(A) Visualization of HT-1080 cell viability over time +/− erastin (Era, 10 µM) and deferoxamine (DFO, 100 µM). (B,C) Cytosolic and lipid ROS production assessed over time (2,4 and 6 hrs) by flow cytometry using H2DCFDA and C11-BODIPY. (D) Mitochondrial ROS assessed in HT-1080 cells treated for 6 hrs with erastin+/−DFO, as above, or with rotenone (250 nM)+/−DFO. In (A–D) representative data from one of four experiments is shown. (E) Erastin-induced death in 143B ρ0 and ρ+ cells. (F) mtDNA-encoded transcript levels in ρ0 and ρ+ cells. Results in (E) and (F) are mean+/−SD from one of three representative experiments.
Figure 2
Figure 2. Erastin-induced oxidative death is iron-dependent
(A) Transmission electron microscopy of BJeLR cells treated with DMSO (10 hrs), erastin (37 µM, 10 hrs), staurosporine (STS, 0.75 µM, 8 hrs), H2O2 (16 mM, 1 hr) and rapamycin (Rap, 100 nM, 24 hr). Single white arrowheads: shrunken mitochondria; paired white arrowheads: chromatin condensation; black arrowheads: cytoplasmic and organelle swelling, plasma membrane rupture; black arrow: formation of double-membrane vesicles. A minimum of 10 cells per treatment condition were examined. (B) Normalized ATP levels in HT-1080 and BJeLR cells treated as in (A) with the indicated compounds. Representative data (mean+/−SD) from one of three independent experiments is shown. (C) Modulatory profiling of known small molecule cell death inhibitors in HT-1080, BJ-eLR and Calu-1 cells treated with erastin (10 µM, 24 hrs). (D) Effect of inhibitors on H2DCFDA-sensitive ROS production in HT-1080 cells treated for 4 hours. (E) Modulatory profiling of ciclopirox olamine (CPX), DFO, ebselen (Ebs), trolox (Tlx), U0126 and CHX on oxidative and non-oxidative lethal agents.
Figure 3
Figure 3. Erastin-induced ferroptosis exhibits a unique genetic profile
(A) Outline of the MitoCarta shRNA screen and confirmation pipeline. (B,C) Six high confidence genes required for erastin-induced ferroptosis. (B) Viability of HT-1080 cells infected with shRNAs for 72 hours and treated with erastin (10 µM, 24 hrs). (C) mRNA levels for hairpins shown in (B) determined using RT-qPCR. Data in (B) and (C) are mean+/−SD from one of three experiments. (D,E) Effect of shRNA-mediated silencing of high-confidence genes using the best hairpin identified by mRNA silencing efficiency in (C) on cell viability. (E) Viability of various cell lines treated with a lethal dose of erastin (indicated in brackets) for 24 hours. (E) Viability of HT-1080 cells treated with various death-inducing or cytostatic compounds. For (D) and (E) % rescue was computed relative to each shRNA alone+DMSO. (F) Cartoon outline of glutamine (Gln) metabolism. Red box indicates mitochondria. (G) Images of HT-1080 cells treated with aminooxyacetic acid (AOA) +/− dimethyl alphaketoglutarate (DMK) +/− erastin.
Figure 4
Figure 4. Identification and characterization of Ferrostatin-1
(A) Structure of ferrostatin-1 (Fer-1). (B) Effect of resynthesized Fer-1 (0.5 µM) on the lethality of various compounds in HT-1080 cells. (C) Effect of Fer-1 and U0126 on ERK phosphorylation in HT-1080 cells. (D) Effect of DFO, CHX, trolox (Tlx) and Fer-1 on HT-1080 cell proliferation over 48 hours as assessed by Vi-Cell. (E) Effect of Fer-1 (0.5 µM) on erastin (10 µM)-induced ROS production in HT-1080 cells (4 hr treatment). (F) Cell-free antioxidant potential monitored by changes is the absorbance at 517 nm of the stable radical DPPH. (G) Dose-response relationship for inhibition of erastin (10 µM, 24 hrs)-induced death in HT-1080 cells by Fer-1 and analogs. (H) Correlation between predicted partition coefficient (log P) and the ability of various Fer-1 analogs to prevent erastin-induced death. (I) Dose-response relationship for inhibition of erastin (10 µM, 24 hrs)-induced death by various antioxidants. (J) Plot of predicted partition coefficient (log P) and ability of various antioxidants to prevent erastin-induced death. Data in (B), (D), (F), (G) and (J) represents mean+/−SD from one of three representative experiments.
Figure 5
Figure 5. Effects of Fer-1 on excitotoxic cell death in organotypic hippocampal slice cultures
(A) Cartoon outline of hippocampal slice procedure. (B) Bright-field and fluorescent images of PI staining of treated hippocampal slices. Slices were treated with glutamate (5 mM, 3 hrs) +/− Fer-1 (2 µM), CPX (5 µM) or MK-801 (10 µM). Representative images from 1 one 6 slices per condition are shown. (C–E) Quantification of the effects depicted in (B). Data were analyzed using a two-way ANOVA (brain region × drug treatment) followed by Bonferroni post-tests. *: P < .05, **: P < .01, ***: P < .001.
Figure 6
Figure 6. Erastin inhibits the activity of system xc
(A) Modulatory profile of HT-1080 cells treated with different lethal compounds and inhibitors. (B) Cartoon depicting the composition and function of system L and system xc. Cys: cystine, NAA: neutral amino acids. (C) SLC7A11 mRNA levels in compound (6 hrs)-treated HT-1080 cells determined by RT-qPCR. (D,E) Effect of silencing SLC7A11 using siRNA on erastin (10 µM, 8 hrs)-induced death (D) and mRNA levels (E) in HT-1080 cells. (F) Na+-independent [14C]-cystine uptake by HT-1080 cells in response to various drugs. (G) Identification of SLC7A5 as the lone target identified by erastin affinity purification in both BJeH and BJeLR cells. (H) Metabolic profiling of system L and non-system L substrate amino acid levels in erastin-treated Jurkat cells. (I) Effect of L-glutamic acid (L-Glu, 12.5 mM) and Dphenylalanine (D-Phe, 12.5 mM) on erastin-induced death in HT-1080 cells.
Figure 7
Figure 7. Role of NOX in erastin-induced death
(A) Outline of NOX pathway. Inhibitors are shown in green. (B) Effect of NOX pathway inhibitors on erastin-induced death in Calu-1 and HT-1080 cells. GKT: GKT137831. (C,D) Effect of shRNA silencing of the PPP enzymes glucose-6-phosphate dehydrogenase (G6PD) and phosphogluconate dehydrogenase (PGD) on viability of erastin (2.5 µM)-treated Calu-1 cells. Infection with shRNA targeting VDAC2 was used as a positive control. Relative mRNA levels in (D) were assessed by qPCR following shRNA knockdown. Data in (B), (C) and (D) represents mean+/−SD. (E) Model of ferroptosis pathway. The core ferroptotic lethal mechanism is highlighted in blue.

Comment in

Similar articles

Cited by

References

    1. Banjac A, Perisic T, Sato H, Seiler A, Bannai S, Weiss N, Kolle P, Tschoep K, Issels RD, Daniel PT, et al. The cystine/cysteine cycle: a redox cycle regulating susceptibility versus resistance to cell death. Oncogene. 2008;27:1618–1628. - PubMed
    1. Bergsbaken T, Fink SL, Cookson BT. Pyroptosis: host cell death and inflammation. Nat Rev Microbiol. 2009;7:99–109. - PMC - PubMed
    1. Cater HL, Gitterman D, Davis SM, Benham CD, Morrison B, 3rd, Sundstrom LE. Stretch-induced injury in organotypic hippocampal slice cultures reproduces in vivo post-traumatic neurodegeneration: role of glutamate receptors and voltage-dependent calcium channels. J Neurochem. 2007;101:434–447. - PubMed
    1. Cheah JH, Kim SF, Hester LD, Clancy KW, Patterson SE, 3rd, Papadopoulos V, Snyder SH. NMDA receptor-nitric oxide transmission mediates neuronal iron homeostasis via the GTPase Dexras1. Neuron. 2006;51:431–440. - PMC - PubMed
    1. Choi DW. Glutamate neurotoxicity and diseases of the nervous system. Neuron. 1988;1:623–634. - PubMed

Publication types