. 2012 May 25;149(5):1073-83.
doi: 10.1016/j.cell.2012.03.044.

Network crosstalk dynamically changes during neutrophil polarization

Affiliations

Network crosstalk dynamically changes during neutrophil polarization

Chin-Jen Ku et al. Cell. .

Abstract

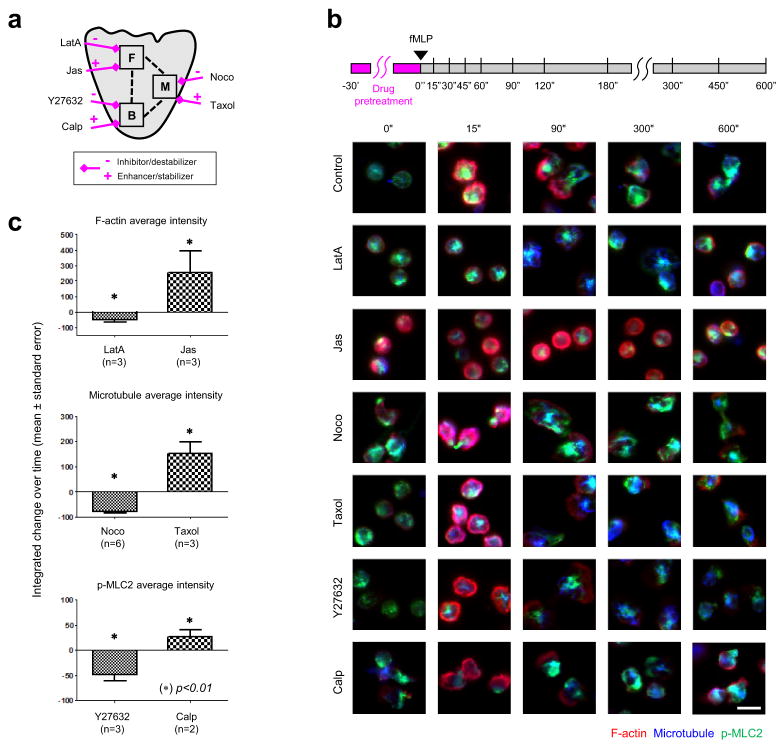
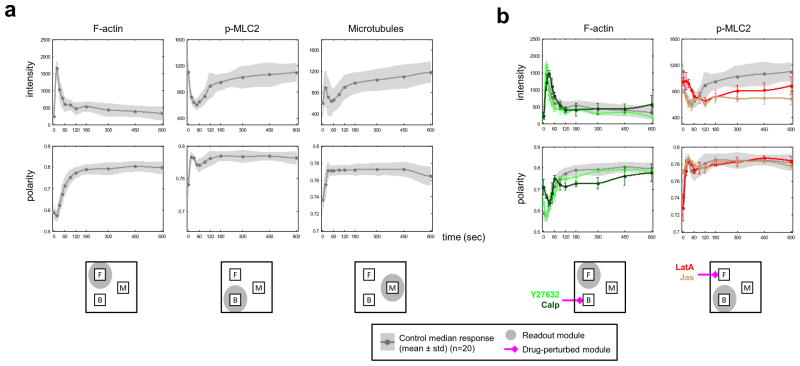
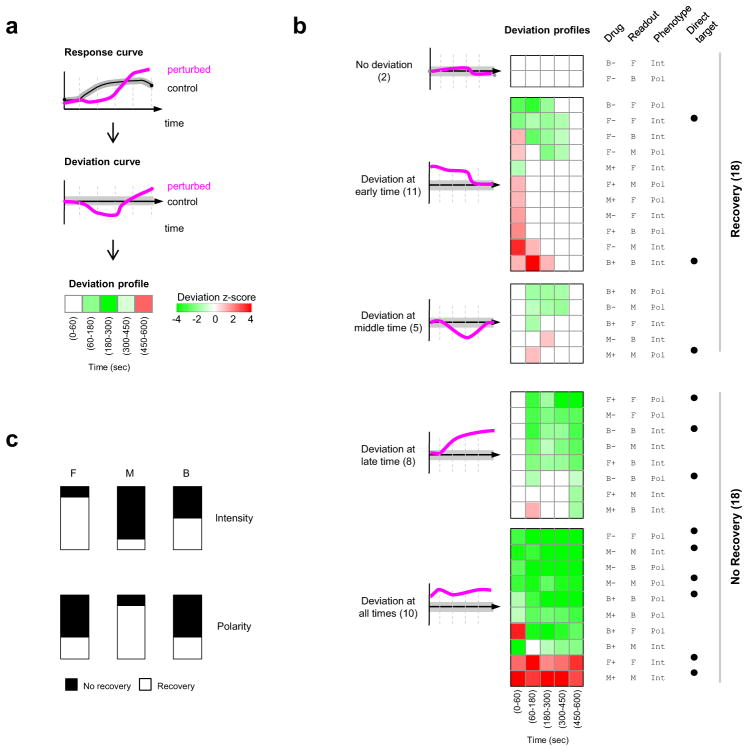
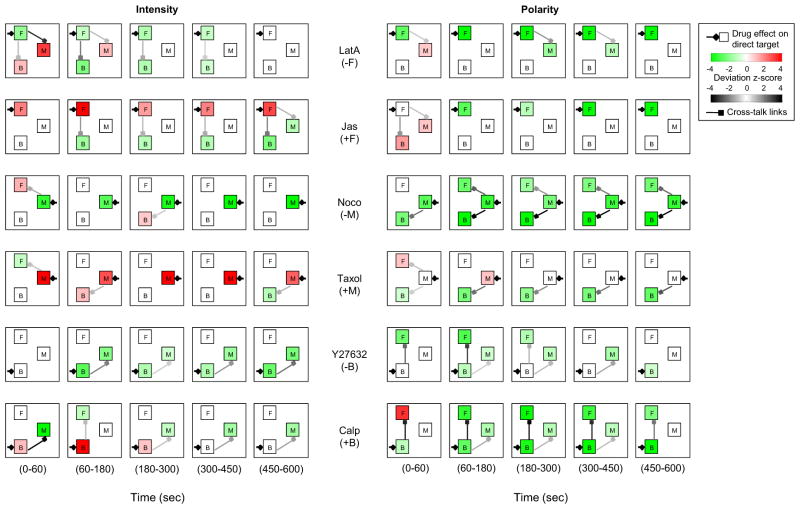
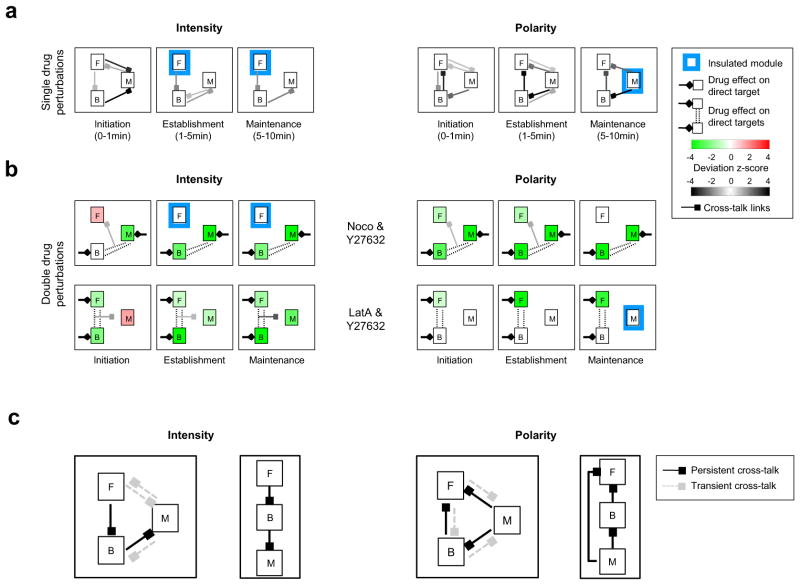
How complex signaling networks shape highly coordinated, multistep cellular responses is poorly understood. Here, we made use of a network-perturbation approach to investigate causal influences, or "crosstalk," among signaling modules involved in the cytoskeletal response of neutrophils to chemoattractant. We quantified the intensity and polarity of cytoskeletal marker proteins over time to characterize stereotyped cellular responses. Analyzing the effects of network disruptions revealed that, not only does crosstalk evolve rapidly during polarization, but also that intensity and polarity responses are influenced by different patterns of crosstalk. Interestingly, persistent crosstalk is arranged in a surprisingly simple circuit: a linear cascade from front to back to microtubules influences intensities, and a feed-forward network in the reverse direction influences polarity. Our approach provided a rational strategy for decomposing a complex, dynamically evolving signaling system and revealed evolving paths of causal influence that shape the neutrophil polarization response.


Figures

Figure 1
Figure 1. Pharmacological perturbations of key modules in the human neutrophil polarity network
A. Simplified schema of the polarity signaling network in primary human neutrophils containing the front (F), back (B), and microtubule (M) modules. Two opposing drug perturbations were chosen to disrupt each of the three modules: latrunculin A (LatA) and jasplakinolide (Jas) for the front; nocodazole (Noco) and taxol (Taxol) for the microtubules; and Y27632 (Y27632) and calpeptin (Calp) for the back. B. Cells were treated for 30 minutes with drugs, stimulated with 10nM fMLP, and fixed at multiple time points. Shown are representative images of human neutrophils at different time points after fMLP stimulation. Color: red (F-actin), blue (microtubules), and green (p-MLC2). Scale bar: 10μm. C. Quantification of opposing drug effects on their targeted modules. Bar graphs show fold-change of overall response to drug perturbation (mean ± standard error across replicate experiments; Supplemental Information). See Figure S1.
Figure 2
Figure 2. Dynamic responses of neutrophils to drug perturbations
A. Neutrophil response curves for front (left), back (middle), and microtubules (right) intensity (top row) and polarity (bottom row) phenotypes. Dark gray curve: mean of median response across replicates (n = 20). Gray band: one standard deviation above and below the mean values. B. Response of front module to perturbations of the back (left) or response of back module to perturbations of the front (right) for intensity (top) and polarity (bottom) phenotypes. Color curves: mean of population median responses (red/brown: front perturbations; bright/dark green: back perturbations). Error bars: standard error of the mean drug responses at different time points. See Figure S2.
Figure 3
Figure 3. Deviation profiles summarized dynamics of perturbation effects
A. Illustration of how deviation profiles were generated by quantifying drug-induced deviations to control response curves at different time intervals (0–1min; 1–3min; 3–5min; 5–7.5min; 7.5–10min) (Supplemental Information). Color map: red/white/green (significantly increased/unchanged/decreased feature value). B. Deviation profiles across phenotypes and perturbations (heatmap) showed various temporal patterns: deviation at no time, early time, middle time, late time, or all times (cartoon illustrations at left; Supplemental Information). Deviation profiles were further grouped depending on whether the deviation disappeared by (i.e. recovery) or persisted through (i.e. no recovery) the end of the polarization process. Numbers next to different labels represented the number of deviation profiles exhibiting the corresponding patterns. C. Distribution of deviation profiles of front, microtubule, and back modules based on their ability to recover (recovery: white; non recovery: black). Top: intensity phenotype. Bottom: polarity phenotype.
Figure 4
Figure 4. Dynamic cross-talk in perturbed neutrophil polarity signaling networks
“Cross-talk diagrams” were constructed by analyzing deviations to each of the signaling modules (F: front module; M: microtubules; B: back module) for each drug perturbation, phenotype, and time interval. Color map for the signaling modules: red (increased intensity/polarity), white (unchanged), green (decreased intensity/polarity). Diamond arrows: drug perturbation to the targeted module. Square arrows: cross-talk from directly to non-directly targeted modules. Square arrows were colored to reflect the strength of drug effects (bright/dark gray: weak/strong deviation). Left column: intensity phenotype. Right column: polarity phenotype. Cross-talk links with small deviations (|z-score| < 1) are not shown. See Figure S3.
Figure 5
Figure 5. Causal networks revealed dynamic, phenotype-dependent cross-talk with persistent interactions arranged in a simple configuration
A. Causal networks across different stages of polarization (initiation, establishment, and maintenance) were constructed by combining cross-talk diagrams across perturbations and time intervals (Supplemental Information). Square arrows: cross-talk from directly to non-directly targeted modules. As in Figure 4, cross-talk with small deviations (|z-score| < 1) are not shown. Blue square: insulated module. B. Cross-talk diagrams obtained from double drug perturbation assays. Double dashed lines indicate both direct drug targets. Top row: Noco & Y27632 and bottom row: LatA & Y27632. Arrows and color map are as in Figure 4. C. Summary of all cross-talk links in the causal networks for intensity (left) and polarity (right) phenotypes. Solid/dotted link: persistent/transient cross-talk. Network motifs obtained from persistent cross-talk between modules are shown to the right of the summarized cross-talk diagrams. See Figure S4.

Similar articles

Cited by

References

    1. Amit I, Garber M, Chevrier N, Leite AP, Donner Y, Eisenhaure T, Guttman M, Grenier JK, Li W, Zuk O, et al. Unbiased reconstruction of a mammalian transcriptional network mediating pathogen responses. Science. 2009;326:257–263. - PMC - PubMed
    1. Bezprozvanny I, Watras J, Ehrlich BE. Bell-shaped calcium-response curves of Ins(1,4,5)P3- and calcium-gated channels from endoplasmic reticulum of cerebellum. Nature. 1991;351:751–754. - PubMed
    1. Boyum A. Isolation of mononuclear cells and granulocytes from human blood. Isolation of monuclear cells by one centrifugation, and of granulocytes by combining centrifugation and sedimentation at 1 g. Scand J Clin Lab Invest Suppl. 1968;97:77–89. - PubMed
    1. Cheong R, Rhee A, Wang CJ, Nemenman I, Levchenko A. Information transduction capacity of noisy biochemical signaling networks. Science. 2011;334:354–358. - PMC - PubMed
    1. de Lichtenberg U, Jensen LJ, Brunak S, Bork P. Dynamic complex formation during the yeast cell cycle. Science. 2005;307:724–727. - PubMed

Publication types

LinkOut - more resources