. 2012 May 25;149(5):1112-24.
doi: 10.1016/j.cell.2012.03.041.

Ca(V)1 and Ca(V)2 channels engage distinct modes of Ca(2+) signaling to control CREB-dependent gene expression

Affiliations

Ca(V)1 and Ca(V)2 channels engage distinct modes of Ca(2+) signaling to control CREB-dependent gene expression

Damian G Wheeler et al. Cell. .

Abstract

Activity-dependent gene expression triggered by Ca(2+) entry into neurons is critical for learning and memory, but whether specific sources of Ca(2+) act distinctly or merely supply Ca(2+) to a common pool remains uncertain. Here, we report that both signaling modes coexist and pertain to Ca(V)1 and Ca(V)2 channels, respectively, coupling membrane depolarization to CREB phosphorylation and gene expression. Ca(V)1 channels are advantaged in their voltage-dependent gating and use nanodomain Ca(2+) to drive local CaMKII aggregation and trigger communication with the nucleus. In contrast, Ca(V)2 channels must elevate [Ca(2+)](i) microns away and promote CaMKII aggregation at Ca(V)1 channels. Consequently, Ca(V)2 channels are ~10-fold less effective in signaling to the nucleus than are Ca(V)1 channels for the same bulk [Ca(2+)](i) increase. Furthermore, Ca(V)2-mediated Ca(2+) rises are preferentially curbed by uptake into the endoplasmic reticulum and mitochondria. This source-biased buffering limits the spatial spread of Ca(2+), further attenuating Ca(V)2-mediated gene expression.


Figures

Figure 1
Figure 1. Mild depolarization signals exclusively through CaV1 channels whereas stronger depolarization recruits CaV2 channels
(A) CREB phosphorylation evoked by 40 mM K+ depolarization to -19 mV was blocked by the CaV1 channel blocker Nim (10 μM). Scale bar, 30 μm. (B) CREB phosphorylation resulting from 90 mM K+, Nim±CaV2.2 toxin GVIA (2 μM) and CaV2.1 toxin Aga (500 nM). Data from ≥30 cells per condition from 2 platings. (C, D) Neurons stimulated for 3 min, then placed in 5K Tyrode's for 42 min before RNA extraction and quantitative RT-PCR for c-fos. Data normalized against three housekeeping genes, plotted relative to control. n=9 coverslips from 3 platings. (E) pCREB levels for various durations of depolarization (≥50 cells, 4 platings). (F) CREB signal strength extracted as initial slope of the plots in (E), plottedagainst measured membrane potentials (n≥5). Fitted line shows steeply risingCaV2 signaling (e-fold change per 4.37 mV). Gray, steepness of CaV1 channelsignaling (Wheeler et al., 2008). Error bars=SEM.
Figure 2
Figure 2. CaV1 channels are advantaged over CaV2 channels in signaling to CREB via CaMKII
(A) Current-voltage relationships of CaV1 and CaV2 channels. Difference between total current and current in GVIA+Aga taken as CaV2-mediated. The remainder was considered CaV1-mediated. n=3. Voltages produced by 20-90 mM K+ are indicated. (B) Fractional contribution of CaV1 and CaV2 channels derived from tail currents (see Figure S1F). (C) CaV1- and CaV2-based portions of Ca2+ transient, obtained with K depolarizations ± Nim. Nim-sensitive portion deemed CaV1; remainder designated as CaV2 (n=18 neurons). The average Δ[Ca2+]i was 100±41 nM, 525±130 nM and 659±184 nM for 20, 40 and 60 mM K+. The 60 K+ response was smaller than expected based on data in A, likely due to supralinear dependence of Ca2+ buffering on Δ[Ca2+]i. Thus, fractional contribution of CaV1 was likely underestimated by Nim dissection. (D) Fura-2 Ca2+ signals from 5 DIV SCG neurons depolarized with 40 or 60 mM K+, Nim for 30 s. 40 K+ chosen so that the largely CaV1-mediated Δ[Ca2+]i was smaller than CaV2-mediated Δ[Ca2+]i. Pooled data from 4 neurons in one field. (E) The Ca2+ transient was invariably larger with 60 mM K+, Nim (blue) than with 40 mM K+ (Lamas et al.)(P<10-16). Lines connect data from the same cell, 6 experiments performed on 1 culture. Black bars, pooled data from multiple cultures (53 cells total). (F) pCREB levels, normalized to 40 mM K+, 3 min response, plotted against time. For reference, the 40 and 90 mM K+ with Nim data, normalized, are replicated from Figure 1E. >60 neurons, 3-4 experiments. (G) CREB signal strength, obtained from (F), plotted against the corresponding peak [Ca2+]i transient. Fura-2 Ca2+ signals from 25-42 cells from 2-4 independent cultures. The data for 40, 60 and 90 mM K+ with Nim were fit by a straight line, slope 3.46 (R=0.997). The dashed line going through the 40 mM K+ point has a slope reflecting the [Ca2+]-dependence of CaV1 signaling previously determined (Wheeler et al., 2008). Green symbol based on data in Figures 4G and 5E. (H) Neurons stimulated with 90 K+ + Nim for 10 s, immediately fixed, then stained for Map2 (Lamas et al.) and pCaMKII (green). Background pCaMKII staining was subtracted (Experimental Procedures). Scale bar, 10 μm. (I) pCaMKII puncta weight from experiments as in (H). N=3 independent experiments. (J) SCG neurons infected with lentivirus expressing α and βCaMKII shRNA or control lentivirus were stimulated with 90 mM K+, Nim for the indicated durations and stained for pCREB. (K) c-fos mRNA in SCG neurons infected as in (J) and stimulated with 90 mM K+, Nim for 180 s, followed by 42 min in 5 mM K+ to allow time for transcription. N=3–4 experiments done in triplicate. Error bars=SEM.
Figure 3
Figure 3. Ca2+ through CaV1 channels engages signaling locally, whereas CaV2-derived Ca2+ acts at a distance from the channel
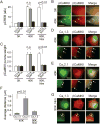
(A) Neurons, mock loaded (−) or loaded with 100 μM EGTA-AM or BAPTA-AM, were stimulated for 60 s with 40 mM K+ or 60 mM K+ with Nim to activate CaV1- and CaV2-dependent signaling to CREB, respectively, then incubated for 45 s in 5 mM K+ solution before fixation and staining for pCREB. n≥50 neurons per condition, 3 separate cultures. (B) Representative images of neurons stimulated with 40 mM K+ for 10 s and stained for pCaMKII (green) and βCaMKII. Scale bar, 5 μm. pCaMKII puncta colocalized with βCaMKII puncta (arrows). (C) Neurons loaded with EGTA or BAPTA were stimulated for 60 s as in (A), fixed immediately after stimulation and stained for βCaMKII. Data are from ≥30 cells per condition from 3 platings. (D) Neurons stimulated with 40 mM K+ and stained with antibodies against CaV1.3 and βCaMKII. Arrows, sites where βCaMKII puncta colocalize with CaV1.3 channels. (E) Neurons stimulated with 40 mM K+ and stained with antibodies against CaV2.1 and βCaMKII. βCaMKII puncta (arrows) are located at sites distinct from CaV2.1 channel puncta (arrowheads). (F) Average nearest-neighbor distance from βCaMKII puncta to various CaV channels following stimulation with 40 mM K+ or with 90 mM K+, Nim. n≥10 puncta per condition. Pooled data from experiments illustrated in panel D (left bar), in panel F (middle bar) and in Figure S3C (right bar). (G) Neurons stimulated with 90 mM K+, Nim were stained with antibodies against CaV1.3 and βCaMKII. Scale bars, 10 μm.
Figure 4
Figure 4. Mitochondria preferentially curb CaV2-mediated Ca2+ rises
(A) Exemplar Fura-2 Ca2+ measurement. FCCP (1 μM) potentiated Ca2+ response to 40 mM K+, indicating suppression of peak response by mitochondrial buffering (↔). (B) Mitochondrial buffering for 20, 40, or 60 mM K+, determined as in (A), plotted against the proportion of the current mediated by CaV2 channels at voltages enforced by K+ challenges (interpolated from data in Fig. 2B). Solid line, linear fit (r=0.99997); n=18-21 cells. (C) Exemplar Fura-2 traces induced by K+ depolarizations. (D) The decay of [Ca2+]i immediately following 90 mM K+ stimulation and modification by GVIA/Aga. Data normalized to peak response, with start of wash as 0 s. The traces show mean±SEM of neurons from ≥4 experiments. (E, F) Exemplar Fura-2 Ca2+ transients measured in response to 40 mM K+, showing effects of FCCP in Nim (E) or after pre-incubation in GVIA/Aga (F). (G) Summary of peak [Ca2+]i elevation, measured as in (E) or (F). n≥19 cells from 2-3 platings. Error bars=SEM.
Figure 5
Figure 5. Ca2+ entering through CaV2 channels is preferentially taken up by mitochondria
(A) Exemplar images of a neuron expressing pericamMT. The color scale represents the ratio of emitted fluorescence upon 485 and 417 nm excitation. Scale bar, 25 μm. (B) Time course of the 485/417 ratio for the same neuron. (C) Representative Fura-2 trace measuring cytosolic Ca2+ levels upon treatment with 20 mM K+ with FPL64176 (10 μM) or 60 mM K+ without FPL. (D) Pooled pericamMT responses from neurons stimulated as in (C), n=31 (left) or 35 (right) neurons, 3 platings. (E) Neurons stimulated with 40 mM K+, alone or in the presence of Nim±FCCP. pCREB immunoreactivity plotted against stimulation duration. n≥38 from 3 platings. (F) GVIA/Aga pre-incubation prevents FCCP-dependent signaling to CREB. n≥33 neurons per condition from 2 platings. (G) Neurons stimulated for 3 min as shown, then placed in 5K+ Tyrode's for another 42 min before RNA extraction and quantitative RT-PCR for c-fos. N=3–4 experiments done in triplicate. (H) c-fos mRNA levels plotted against the corresponding [Ca2+]i transient. Fura-2 Ca2+ measurements from 25-42 cells from 2-4 independent cultures. Error bars=SEM.
Figure 6
Figure 6. Mitochondrial buffering of CaV2 channels sculpts signaling to CREB triggered by action potentials
(A) Driving action potentials in SCG neurons with field stimulation (inset: representative current-clamp recordings) revealed a bell-shaped frequency-dependence of the pCREB response with a peak at 10 Hz. Data from ≥20 cells per condition from 2 platings. (B) c-fos mRNA levels, measured 180 s stimulation followed by 42 min rest. n=9 coverslips from 3 platings. (C, E) CREB phosphorylation measured following stimulation at 10 Hz (C) or 100 Hz (E). Stimulation for 60 s, with and without Nim, M7C (5 mM) and FCCP. ≥20 cells per condition from 2 platings. (D, F) Fura-2 Ca2+ transients, recorded with 10 or 100 Hz stimulation, normalized to basal ratiometric level, and pooled. Data from ≥30 cells per condition, 2 platings. (G) CREB phosphorylation after field stimulation with Thapsi (2 μM), ±EGTA. Neurons were pre-incubated for 1 min with Thapsi or FCCP, ±Nim or M7C, before 100 Hz stimulation. ≥20 cells per condition from 2 platings. (H) Effects of Thapsi on Fura-2 Ca2+ responses to stimulation at 10 Hz or at 100 Hz with Nim present. ≥30 cells from 2 platings. Error bars represent SEM.
Figure 7
Figure 7. Factors supporting ER preference for CaV2-derived Ca2+
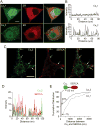
(A) Exemplar confocal images of cultured SCG neurons immunostained with antibodies directed against either CaV1.3 or CaV2.1 and the ER marker PDI. Scale bar, 10 μm. (B) Intensity profiles extracted from images in A. Respective profiles scaled to have equal areas. (C) Exemplar confocal image of a SCG neuron immunostained with antibodies directed against CaV2.1 and SERCA. Scale bar, 10 μm. (D) Intensity profile extracted from images in C. (E) Cumulative distribution of edge-to-edge distances between CaV1.3 or CaV2.1 puncta and the closest SERCA punctum. In 48% of cases, the SERCA punctum frankly overlapped with the profile of the CaV2.1 puncta, extended by 125 nm to allow for lateral diffusion of Ca2+.

Similar articles

Cited by

References

    1. Adams JP, Dudek SM. Late-phase long-term potentiation: getting to the nucleus. Nat Rev Neurosci. 2005;6:737–743. - PubMed
    1. Akita T, Kuba K. Functional triads consisting of ryanodine receptors, Ca(2+) channels, and Ca(2+)-activated K(+) channels in bullfrog sympathetic neurons. Plastic modulation of action potential. J Gen Physiol. 2000;116:697–720. - PMC - PubMed
    1. Alonso MT, Manjarres IM, Garcia-Sancho J. Modulation of calcium signalling by intracellular organelles seen with targeted aequorins. Acta Physiol (Oxf) 2009;195:37–49. - PubMed
    1. Babcock DF, Hille B. Mitochondrial oversight of cellular Ca2+ signaling. Current opinion in neurobiology. 1998;8:398–404. - PubMed
    1. Berridge MJ. Smooth muscle cell calcium activation mechanisms. The Journal of physiology. 2008;586:5047–5061. - PMC - PubMed

Publication types