. 2012 May 25;149(5):1125-39.
doi: 10.1016/j.cell.2012.03.039.

A distal axonal cytoskeleton forms an intra-axonal boundary that controls axon initial segment assembly

Affiliations

A distal axonal cytoskeleton forms an intra-axonal boundary that controls axon initial segment assembly

Mauricio R Galiano et al. Cell. .

Abstract

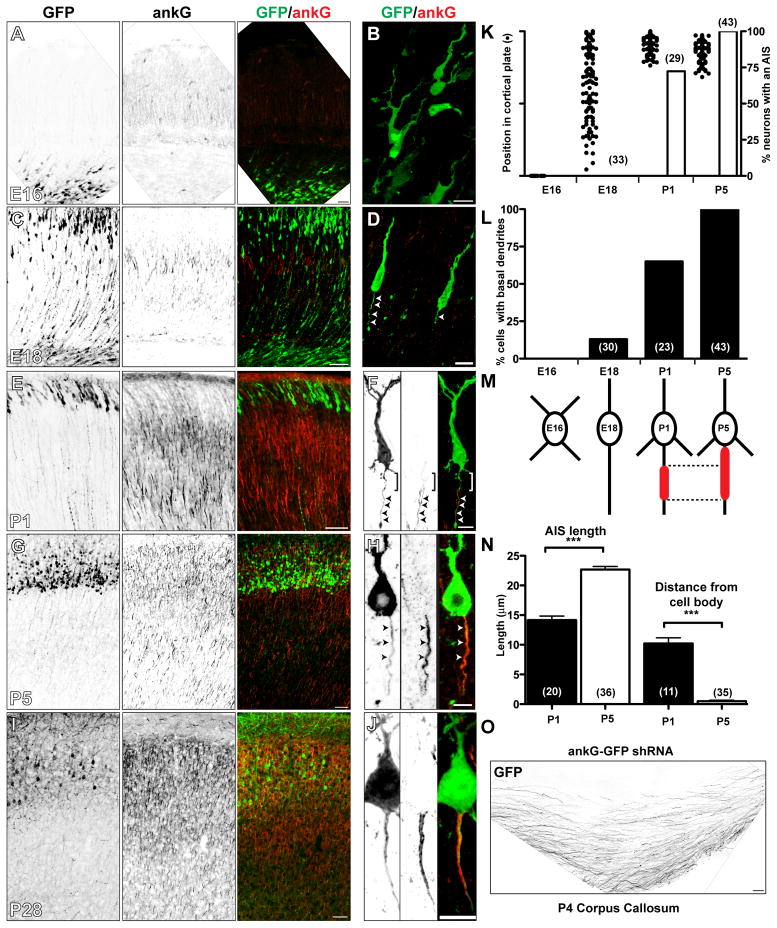
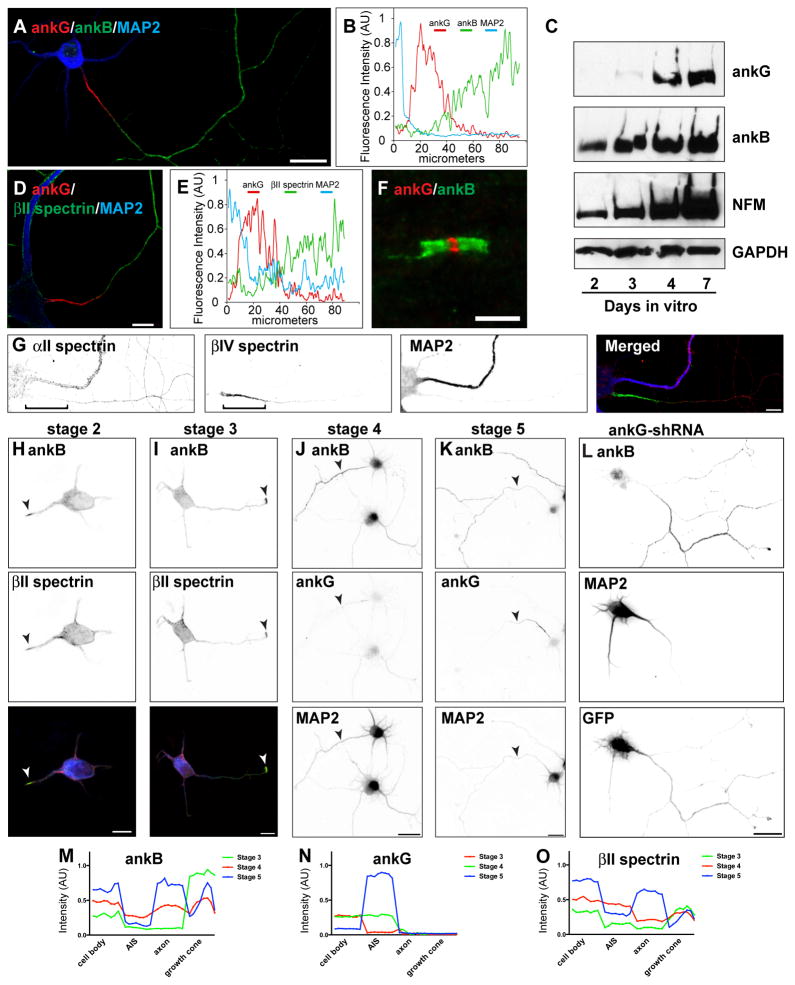
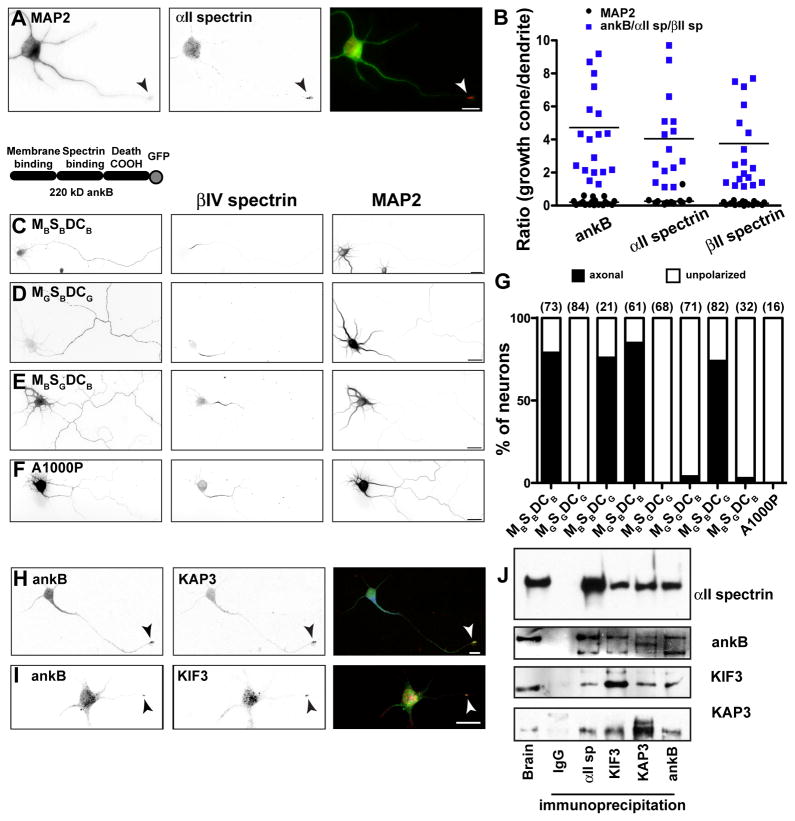
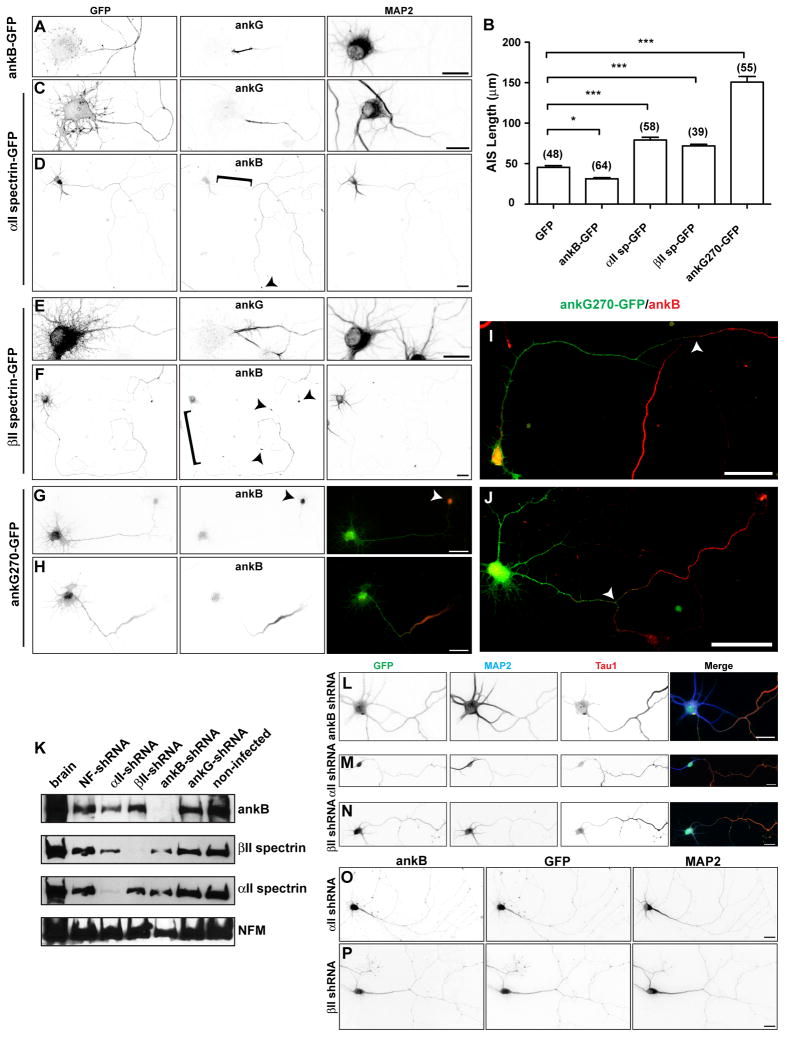
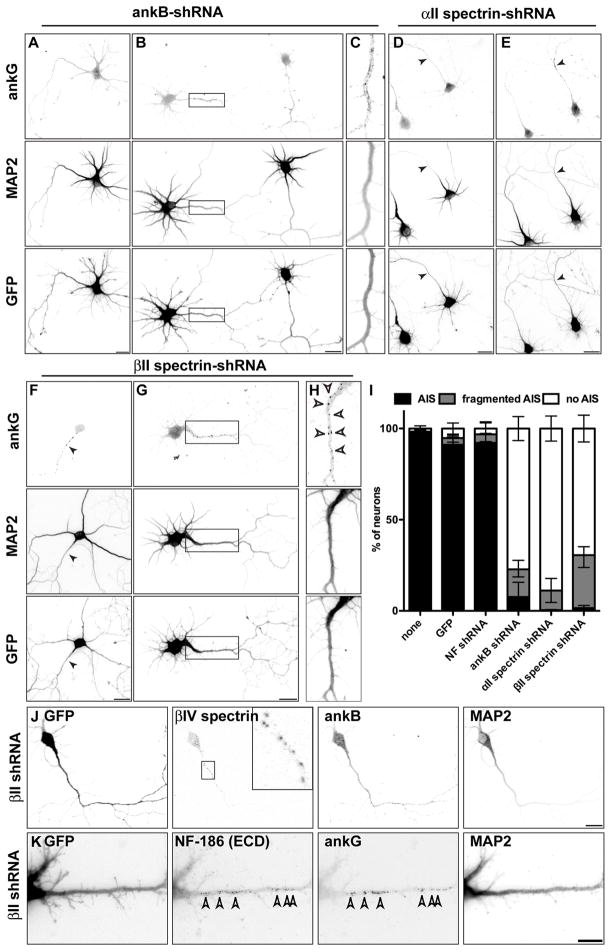
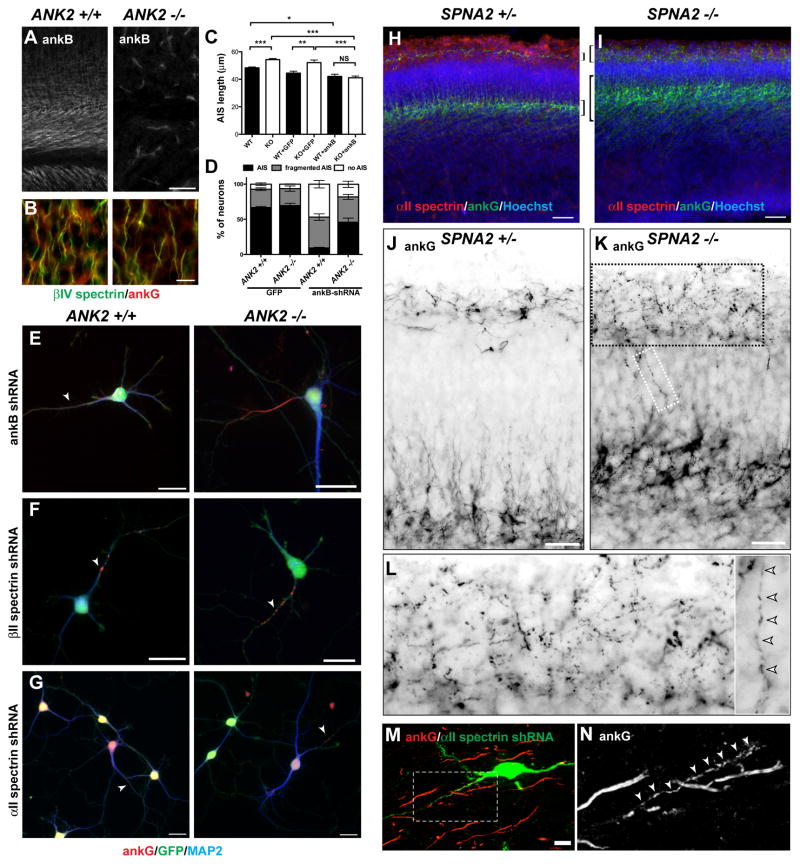
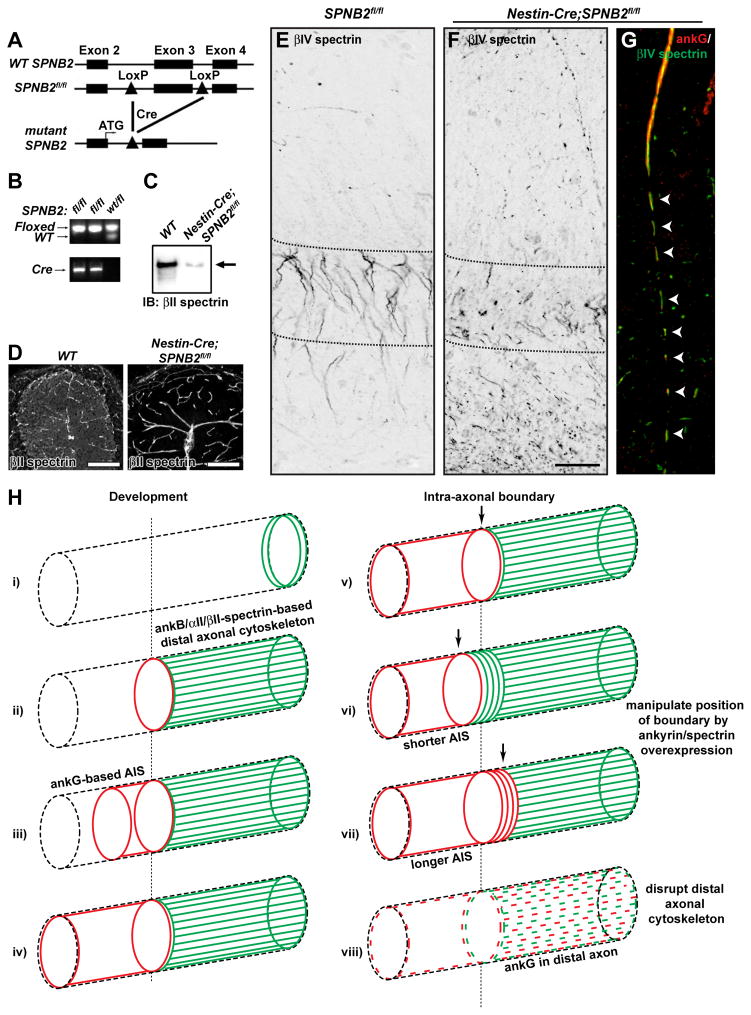
AnkyrinG (ankG) is highly enriched in neurons at axon initial segments (AISs) where it clusters Na(+) and K(+) channels and maintains neuronal polarity. How ankG becomes concentrated at the AIS is unknown. Here, we show that as neurons break symmetry, they assemble a distal axonal submembranous cytoskeleton, comprised of ankyrinB (ankB), αII-spectrin, and βII-spectrin, that defines a boundary limiting ankG to the proximal axon. Experimentally moving this boundary altered the length of ankG staining in the proximal axon, whereas disruption of the boundary through silencing of ankB, αII-spectrin, or βII-spectrin expression blocked AIS assembly and permitted ankG to redistribute throughout the distal axon. In support of an essential role for the distal cytoskeleton in ankG clustering, we also found that αII and βII-spectrin-deficient mice had disrupted AIS. Thus, the distal axonal cytoskeleton functions as an intra-axonal boundary restricting ankG to the AIS.


Figures

Figure 1
Figure 1. AnkG clustering follows and is dispensible for axon specification
(A–J) Neurons electroporated in utero at E14 with GFP plasmids and immunostained for GFP (green) and ankG (red) at embryonic day 16 (E16) (A, B), E18 (C, D), postnatal day 1 (P1) (E, F), P5 (G, H), and P28 (I, J). Scale bars: A, 25 μm; B, D, F, J, 10 μm; C, E, G, I, 50 μm; H, 5 μm. (K) The percentage of GFP-electroporated neurons with an AIS defined by ankG (vertical bars) and their positions in the cortical plate (dots). The number of cells analyzed is indicated in parentheses. (L) The percentage of GFP-electroporated neurons with basal dendrites. (M) Cartoon illustrating the transition in cellular morphology, the position and length of ankG along the axon. (N) The length and distance from the cell body of the ankG-labeled AIS. (O) GFP-labeled axons from neurons expressing the ankG-shRNA construct cross the corpus callosum. Scale bar, 50 μm.
Figure 2
Figure 2. AnkB, αII spectrin, and βII spectrin comprise a distal submembranous cytoskeleton assembled before ankG clustering
(A) Immunostaining of a 10 DIV hippocampal neuron for MAP2 (blue), ankG (red), and ankB (green). Scale bar, 20 μm. (B) Line-scan of fluorescence intensity along the axon shown in (A). (C) Immunoblot analysis of cultured hippocampal neurons. Immunoblotting was performed for ankG, ankB, Neurofilament M (NFM), and GAPDH as a loading control. (D) Immunostaining of a 10 DIV hippocampal neuron labeled for MAP2 (blue), ankG (red), and βII spectrin (green). Scale bar, 10 μm. (E) Line-scan of fluorescence intensity along the axon shown in (D). (F) Node of Ranvier immunostained for ankG (red) and ankB (green). Scale bar, 5 μm. (G) Immunostaining of a 10 DIV hippocampal neuron labeled for αII spectrin (red), βIV spectrin (green), and MAP2 (blue). Scale bar, 10 μm. (H–I) AnkB (green) and βII spectrin (red) are enriched at the tips of newly specified axons (arrowheads). In the merged image, MAP2 is shown in blue. Scale bar, 10 μm. (J–K) Immunostaining for ankB, ankG, and MAP2. Arrowheads indicate axons. Scale bar, 20 μm. (L) Cultured hippocampal infected with ankG-shRNA adenovirus at DIV 0, and analyzed at 7 DIV. AnkB is enriched in axons lacking ankG. Scale bar, 20 μm. (M–O) Fluorescence intensity measurements for ankB, ankG, and βII spectrin taken from the soma, AIS, axon, and growth cone.
Figure 3
Figure 3. Developmental assembly of the distal axonal cytoskeleton
(A) Stage 3 hippocampal neuron labeled for MAP2 (green) and αII spectrin (red). The arrowhead indicates the growth cone. Scale bar, 10 μm. (B) The ratio of growth cone to dendrite fluorescence intensity for ankB, αII spectrin, and βII spectrin immunofluorescence (blue squares). (C–E) Cultured hippocampal neurons transfected with 220 kD ankB-GFP (MBSBDCB), or chimeras of ankB-GFP and ankG-GFP, and labeled for GFP, βIV spectrin and MAP2. The analysis was performed at 7 DIV. Scale bar, 25 μm. (F) Cultured hippocampal neuron transfected with A1000P ankB-GFP, and labeled for GFP, βIV spectrin, and MAP2. The analysis was performed at 7 DIV. Scale bar, 25 μm. (G) Quantification of axonal polarity using ankB and ankG chimeras. The number of cells analyzed is shown in parentheses. (H, I) Stage 3 hippocampal neuron labeled for ankB (green) and KAP3 (H; red) or KIF3 (I; red). The arrowhead indicates the growth cone. Scale bar, 10 μm. (J) Immunoprecipitation reactions from brain lysates using antibodies against αII spectrin, ankB, KIF3, and KAP3.
Figure 4
Figure 4. Overexpression of ankyrins and spectrins shifts the intra-axonal barrier
(A) Cultured hippocampal neuron transfected with ankB-GFP at DIV 0 and immunostained for GFP, ankG, and MAP2 at DIV 7. Scale bar, 20 μm. (B) Quantification of AIS length (ankG immunoreactivity) after transfection of the indicated proteins. (C–D) Cultured hippocampal neuron transfected with αII spectrin-GFP at DIV 0 and immunostained for GFP, ankG (C) or ankB (D), and MAP2 at DIV 7. Brackets indicate the proximal axon, and arrowheads indicate the growth cone. Scale bar, 20 μm. (C) (E–F) Cultured hippocampal neuron transfected with βII spectrin-GFP at DIV 0 and immunostained for GFP, ankG (C) or ankB (D), and MAP2 at DIV 7. Brackets indicate the proximal axon, and arrowheads indicate the growth cone. Scale bar, 20 μm. (G–H) Cultured hippocampal neurons transfected with ankG270-GFP at DIV 0, immunolabeled for GFP and ankB at DIV 3. Arrowhead in (G) indicates the end of the axon. Scale bar, 25 μm. (I-J) Cultured hippocampal neurons transfected with ankG270-GFP at DIV 0, immunolabeled for GFP and ankB (at DIV 7). Arrowheads indicate the location of the intra-axonal boundary. Scale bar, 50 μm. (K) Immunoblots of DIV 7 cultured hippocampal neurons infected with adenovirus to silence expression of the indicated proteins. Each lane corresponds to proteins from two replicate wells. Neurofilament-M (NFM) was used as a loading control. (L–N) Hippocampal neurons infected at DIV 0 with adenovirus to silence expression of ankB (L), αII spectrin (M), and βII spectrin (N), and labeled for GFP (green), MAP2 (blue), and Tau1 (red) at DIV 7. Scale bars, 25 μm. (O–P) Hippocampal neurons infected at DIV 0 with adenovirus to silence expression of αII spectrin (O) or βII spectrin (P), and labeled for ankB, GFP, and MAP2 at DIV 7. Scale bars, 25 μm.
Figure 5
Figure 5. Loss of ankB, αII spectrin, or βII spectrin inhibits ankG clustering
(A–H) Hippocampal neurons infected at DIV 0 with ankB-shRNA (A–C), αII spectrin-shRNA (D–E), and βII spectrin-shRNA (F–H) adenovirus and immunostained for ankG, MAP2, and GFP at DIV7. Boxes in (B) and (G) corresponds to panels (C) and (H), respectively. Scale bars, 20 μm. (I) Quantification of the staining patterns for ankG. Data are mean ± SD. The total number of neurons counted was 467 (none), 402 (GFP), 426 (NF shRNA), 571 (ankB shRNA), 502 (αII spectrin shRNA), and 526 (βII spectrin shRNA). (J–K) Neurons infected at DIV 0 with βII spectrin-shRNA adenovirus and immunostained for GFP, βIV spectrin, ankB, and MAP2 (J) or GFP, NF-186 ectodomain (ECD), ankG, and MAP2 (K) at DIV 7. Scale bars, 20 μm.
Figure 6
Figure 6. Analysis of ankB-deficient (ANK2 −/−) and αII spectrin-deficient (SPNA2 −/−) mice
(A) AnkB immunostaining of ANK2 +/+ and ANK2 −/− mice. Scale bar, 25 μm. (B) βIV spectrin (green) and ankG (red) immunostaining of ANK2 +/+ and ANK2 −/− cortex. Scale bar, 10 μm. (C) AIS length at 7 DIV from ANK2 +/+ and ANK2 −/− neurons in vitro untransfected, or transfected with GFP or ankB-GFP. Error bars indicate ±SEM. *** P < 0.0001; ** P < 0.001; * P < 0.01; NS, not significant. (D) The percentage of ANK2 +/+ and ANK2 −/− neurons with a normal, fragmented, or no AIS after viral transduction to express GFP or ankB shRNA. Error bars indicate ±SEM. (E–G) Immunostaining of hippocampal neurons from ANK2 +/+ and ANK2 −/− mice after silencing of ankB (E), βII spectrin (F), or αII spectrin (G). All neurons shown were transduced and GFP+. Arrows indicate fragmented AIS. Scale bars, 20 μm. (H–I) E15 cortex from SPNA2 +/− (H) and SPNA2 −/− (I) mice immunostained for αII spectrin (red), ankG (green), and Hoechst (blue). Brackets indicate cortical layers with high levels of ankG immunoreactivity. Scale bars, 50 μm. (J–K) E15 cortex from SPNA2 +/− (J) and SPNA2 −/− (K) mice immunostained for ankG (green). The regions shown span the two main layers labeled by ankG as shown in panels (H–I).. Scale bars, 25 μm. (L) Higher magnification images from boxed regions in panel (K) show fragmented ankG immunoreactivity (arrowheads). (M) αII spectrin shRNA-electroporated neurons at P28 labeled for GFP (green) and ankG (red). Scale bar, 10 μm. (N) Boxed region from (M) showing fragmented ankG immunoreactivity.
Figure 7
Figure 7. Analysis of a nervous system specific βII spectrin-deficient mouse
(A) Schematic representation of the genomic wild-type SPNB2 (WT SPNB2), floxed (SPNB2fl/fl), and mutant loci. (B) PCR analysis of genomic tail DNA of mutant (fl/fl) or heterozygous (wt/fl) mice. (C) Immunoblot analysis of βII spectrin in brain lysates from wild-type (WT) or Nestin-Cre;SPNB2fl/fl mice. (D) βII spectrin immunostaining of WT and Nestin-Cre;SPNB2fl/fl cerebellum. High levels of βII spectrin immunoreactivity remain in the vasculature. Scale bar, 100 μm. (E–F) βIV spectrin labeling of SPNB2fl/fl (E) and Nestin-Cre;SPNB2fl/fl hippocampus. Scalebar, 50 μm. (G) AnkG (red) and βIV spectrin (green) Immunostaining of Nestin-Cre;SPNB2fl/fl axon. Arrowheads indicate the fragmented AIS. (H) i) AnkB, αII spectrin, and βII spectrin are located in the distal growth cone during axonogenesis. ii) AnkB, αII spectrin, and βII spectrin comprise a distal axonal cytoskeleton that is assembled before ankG clustering. iii) AnkG accumulates at the distal end of the future AIS, at the boundary with the distal axonal submembranous cytoskeleton. iv) AnkG fills and defines the AIS in a distal to proximal direction. v) The transition from ankG/βIV spectrin to ankB/αII spectrin/βII spectrin along the axon defines the intra-axonal boundary. vi) Overexpression of ankB causes a proximal shift of the intra-axonal boundary and a shorter AIS. vii) Overexpression of ankG causes a distal shift of the intra-axonal boundary and a longer AIS. viii) Loss of the intra-axonal boundary by disruption of the distal axonal cytoskeleton blocks AIS assembly and permits ankG to be found in the distal axon.

Comment in

Similar articles

Cited by

References

    1. Barnes AP, Polleux F. Establishment of axon-dendrite polarity in developing neurons. Annu Rev Neurosci. 2009;32:347–381. - PMC - PubMed
    1. Bennett V, Baines AJ. Spectrin and ankyrin-based pathways: metazoan inventions for integrating cells into tissues. Physiol Rev. 2001;81:1353–1392. - PubMed
    1. Boiko T, Vakulenko M, Ewers H, Yap CC, Norden C, Winckler B. Ankyrin-dependent and -independent mechanisms orchestrate axonal compartmentalization of L1 family members neurofascin and L1/neuron-glia cell adhesion molecule. J Neurosci. 2007;27:590–603. - PMC - PubMed
    1. Brachet A, Leterrier C, Irondelle M, Fache MP, Racine V, Sibarita JB, Choquet D, Dargent B. Ankyrin G restricts ion channel diffusion at the axonal initial segment before the establishment of the diffusion barrier. J Cell Biol. 2010;191:383–395. - PMC - PubMed
    1. Davis JQ, Lambert S, Bennett V. Molecular composition of the node of Ranvier: identification of ankyrin-binding cell adhesion molecules neurofascin (mucin+/third FNIII domain−) and NrCAM at nodal axon segments. Journal of Cell Biology. 1996;135:1355–1367. - PMC - PubMed

Publication types