. 2012 May 25;149(5):1152-63.
doi: 10.1016/j.cell.2012.03.038.

Identification of the cortical neurons that mediate antidepressant responses

Affiliations

Identification of the cortical neurons that mediate antidepressant responses

Eric F Schmidt et al. Cell. .

Abstract

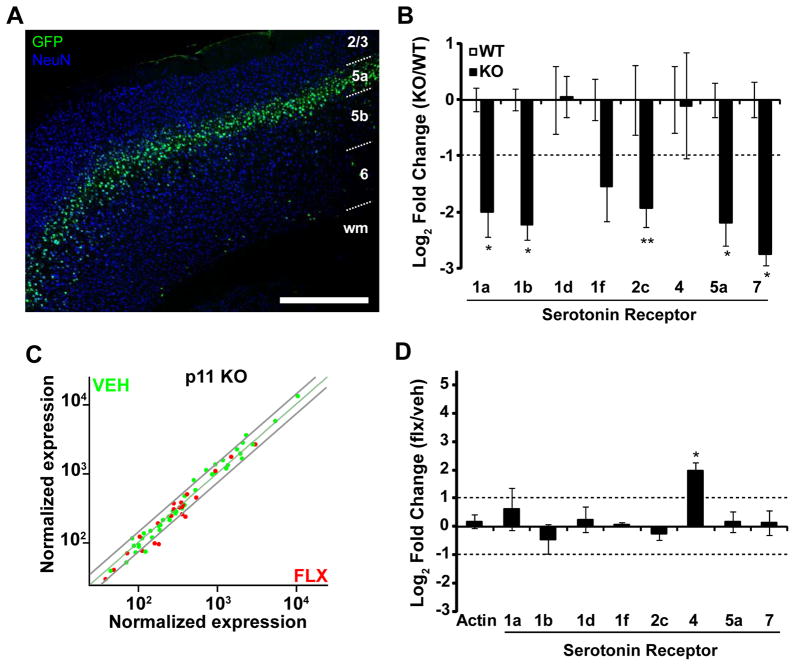
Our understanding of current treatments for depression, and the development of more specific therapies, is limited by the complexity of the circuits controlling mood and the distributed actions of antidepressants. Although the therapeutic efficacy of serotonin-specific reuptake inhibitors (SSRIs) is correlated with increases in cortical activity, the cell types crucial for their action remain unknown. Here we employ bacTRAP translational profiling to show that layer 5 corticostriatal pyramidal cells expressing p11 (S100a10) are strongly and specifically responsive to chronic antidepressant treatment. This response requires p11 and includes the specific induction of Htr4 expression. Cortex-specific deletion of p11 abolishes behavioral responses to SSRIs, but does not lead to increased depression-like behaviors. Our data identify corticostriatal projection neurons as critical for the response to antidepressants, and suggest that the regulation of serotonergic tone in this single cell type plays a pivotal role in antidepressant therapy.


Figures

Figure 1
Figure 1. The S100a10 bacTRAP mouse line labels a subpopulation of pyramidal cells in the cerebral cortex
(A) Schematic depicting the modification of the BAC vector containing the S100a10 gene by RecA mediated homologous recombination in bacteria. Exons 1–3 of the S100a10 gene are represented by black bars. A and A′ refer to the homology region used for recombination. Upstream and downstream transcriptional regulatory elements are represented by white bars on the BAC vector. The red box following the EGFP-L10a transgene represents the polyA site. (B) Low magnification anti-EGFP IF image of EGFP-L10a transgene expression in the brain of S100a10 bacTRAP mouse. See also Figure S1. Scale bar, 2 mm. (C) EGFP-L10a expression in multiple regions of neocortex. EGFP (green) and NeuN (red) staining are shown. Layers are indicated. Scale bar, 500 μm. (D) High magnification image of cell bodies of EGFP+ cells. Apical dendrites are indicated by double arrowheads (where visible). In cases where the apical dendrite is out of the plane of section, single arrowheads indicate the base. Scale bar, 25 μm. (E) Double-labeling with anti-EGFP and anti-p11 antibodies in WT (top row) and constitutive p11 KO (bottom row) in sensorimotor cortex of S100a10 bacTRAP mice. Scale bar, 50 μm.
Figure 2
Figure 2. Retrograde tracing reveals axonal targets of S100a10-expressing cells
(A) Representative images from CTβ injections into dorsal striatum (CPu; top row), nucleus accumbens (NAc, middle row), and contralateral cortex (bottom row). Left panels are low magnification images of cortex with the injection site shown in inset, and right three panels are higher magnification IF images of double-labeling with anti-EGFP and anti-CTβ antibodies. Arrows indicate double-labeled cells; asterisks indicate CTβ+ cells that are not co-labeled with EGFP. See also Figure S2. (B) Histogram of the depth of the cell bodies of EGFP+ cells (EGFP), and CTβ+ cells projecting to CPu or spinal cord (SpC) in motor cortex (left), and CTβ+ commissural projection neurons (Cortex) in sensory cortex (right). (C) Quantification (Mean±SEM) of the number of CTβ+ cells that were co-labeled with EGFP following injections into CPu, NAcc, and contralateral cortex. (D) Schematic demonstrating the projection targets of S100a10-expressing cortical projection neurons. Brain diagram was modified from (Franklin and Paxinos, 2008).
Figure 3
Figure 3. S100a10 and Glt25d2 are molecularly distinct cell populations
(A) Scatter plot comparing normalized expression values of neuronal genes (see Figure S4 and Table S1) in S100a10 IP (x-axis) or whole cortex input (y-axis). Blue dots represent individual probe sets. Outer gray lines represent 1.5-fold enrichment in either sample. Probe sets representing the S100a10 gene are circled. (B) Quantification (Mean±SEM) of expression of control genes (Aldh1l1, Cnp, Gad1, and Slc17a7) and previously reported BAC driver genes (Etv1 and Ntsr1, gray bars) by qRT-PCR in S100a10 IP versus whole cortex (UB) RNA. Dotted lines mark 2-fold regulation. *p<0.05; **p<0.01 (C) Scatter plot comparing normalized expression values of CST (red dots) or CPN (blue dots) markers (see Figure S3 and Table S2) in Glt25d2 (x-axis) or S100a10 (y-axis) IP samples. Outer gray lines represent 1.5-fold enrichment in either cell population. Probe sets representing S100a10 and Glt25d2 are indicated. (D) qRT-PCR quantification (Mean±SEM) of the expression of cortex layer 5 genes in S100a10 IP compared to either Glt25d2 IP (white bars) or whole cortex (UB, gray bars). Positive values indicate enrichment in S100a10 IP while negative values indicate enrichment in UB or Glt25d2 IP. Dotted lines mark 2-fold regulation. p<0.05 for all genes shown. (E–J) In situ hybridizations showing expression patterns in cortex of genes enriched in S100a10 (E–I) or Glt25d2 (J) cells. All images are from the Allen Brain Atlas.
Figure 4
Figure 4. Cell type specific molecular responses to SSRI treatment
(A) The level of p11 mRNA was quantified by ISH and expressed as percent of control (Mean±SEM). Representative images are shown below the graph. *p<0.05 (B) Scatter plot comparing normalized expression values of FLX (x-axis) or VEH (y-axis) treated cortex IP samples from S100a10 (left) or Glt25d2 (right) bacTRAP mice. Dots represent probe sets that are significantly increased (red) or decreased (green) greater than 1.4 fold by drug treatment (see Table S3). Outer gray lines represent 1.4-fold enrichment in either sample. (C) Quantification of Htr expression following chronic FLX in S100a10 and Glt25d2 cells by qRT-PCR (Mean±SEM). Positive values indicate upregulation and negative values indicate downregulation by FLX. Dotted lines show a 2-fold change in either direction. *p<0.05 (D) Quantification of Htr expression following chronic FLX in whole cortex by qRT-PCR (Mean±SEM).
Figure 5
Figure 5. Molecular changes are dependent on p11 expression
(A) Anti-EGFP IF image of EGFP-L10a expression in constitutive p11 KO mice crossed to the S100a10 bacTRAP line. See Figure S5 for further anatomical analysis. (B) Quantification of Htr expression in IP RNA from S100a10 bacTRAP/p11 KO relative to WT cortex by qRT-PCR (Mean±SEM). Dotted line indicates a 2-fold change. Negative values indicate down-regulation in KO compared to WT. *p<0.05, ** p<0.01 (C) Scatter plot comparing normalized expression values of FLX (x-axis) or VEH (y-axis) treated cortex IP samples from S100a10 bacTRAP/p11 KO mice. Dots represent probe sets that are significantly increased (red) or decreased (green) greater than 1.4 fold by drug treatment in WT cortex (see Figure 4B and Table S3). Outer gray lines represent 1.4-fold enrichment in either sample. (D) Quantification of Htr expression following chronic FLX in S100a10 bacTRAP/p11 KO cells by qRT-PCR (Mean±SEM). Positive values indicate upregulation and negative values indicate downregulation by FLX treatment. Dotted lines indicate a 2-fold change in either direction. *p<0.05
Figure 6
Figure 6. Cortical expression of p11 is required for behavioral responses to chronic SSRI administration
(A) Anti-p11 IF in brain sections from floxed p11 mice (WT, top row) and Emx1/p11KO mice (bottom row) from layer 5 of sensorimotor cortex (left panels), striatum (center), or dentate gyrus (right). Inset shows anti-NeuN staining from the same field. Asterisks label p11-positive cells. (B) Bar graph representing the effect of chronic FLX treatment on the latency to feed in WT and Emx1/p11 KO (Cortex KO) mice in the novelty NSF paradigm (Mean±SEM). **p<0.01. (C) Bar graph representing the effect of chronic FLX treatment on immobility in WT and Emx1/p11 KO (Cortex KO) mice in TST (Mean±SEM). *p<0.05 (D) Bar graph representing thigmotaxis in an open field in WT or Emx1/p11 KO (Cortex KO) mice (Mean±SEM). (E) Bar graph representing sucrose preference in WT or Emx1/p11 KO (Cortex KO) mice (Mean±SEM). Dotted line indicates no preference. See also Figure S5.

Similar articles

Cited by

References

    1. Anisman H, Du L, Palkovits M, Faludi G, Kovacs GG, Szontagh-Kishazi P, Merali Z, Poulter MO. Serotonin receptor subtype and p11 mRNA expression in stress-relevant brain regions of suicide and control subjects. J Psychiatry Neurosci. 2008;33:131–141. - PMC - PubMed
    1. Arlotta P, Molyneaux BJ, Chen J, Inoue J, Kominami R, Macklis JD. Neuronal subtype-specific genes that control corticospinal motor neuron development in vivo. Neuron. 2005;45:207–221. - PubMed
    1. Covington HE, 3rd, Lobo MK, Maze I, Vialou V, Hyman JM, Zaman S, LaPlant Q, Mouzon E, Ghose S, Tamminga CA, et al. Antidepressant effect of optogenetic stimulation of the medial prefrontal cortex. The Journal of neuroscience: the official journal of the Society for Neuroscience. 2010;30:16082–16090. - PMC - PubMed
    1. Cryan JF, Mombereau C, Vassout A. The tail suspension test as a model for assessing antidepressant activity: review of pharmacological and genetic studies in mice. Neurosci Biobehav Rev. 2005;29:571–625. - PubMed
    1. Delgado MR. Reward-related responses in the human striatum. Ann N Y Acad Sci. 2007;1104:70–88. - PubMed

Publication types