. 2012 Jun 8;46(5):561-72.
doi: 10.1016/j.molcel.2012.04.027. Epub 2012 May 24.

Antibiotic-induced bacterial cell death exhibits physiological and biochemical hallmarks of apoptosis

Affiliations

Antibiotic-induced bacterial cell death exhibits physiological and biochemical hallmarks of apoptosis

Daniel J Dwyer et al. Mol Cell. .

Abstract

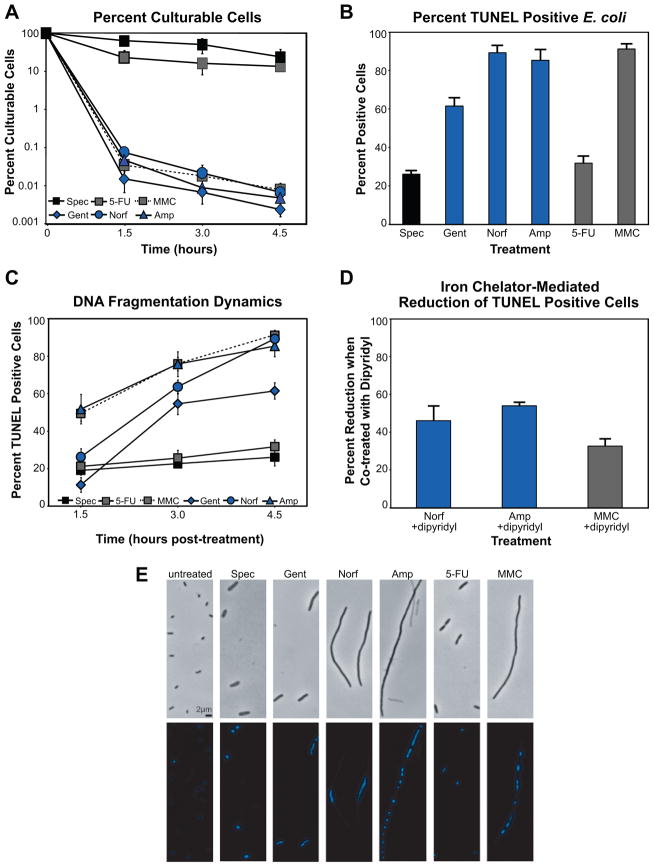
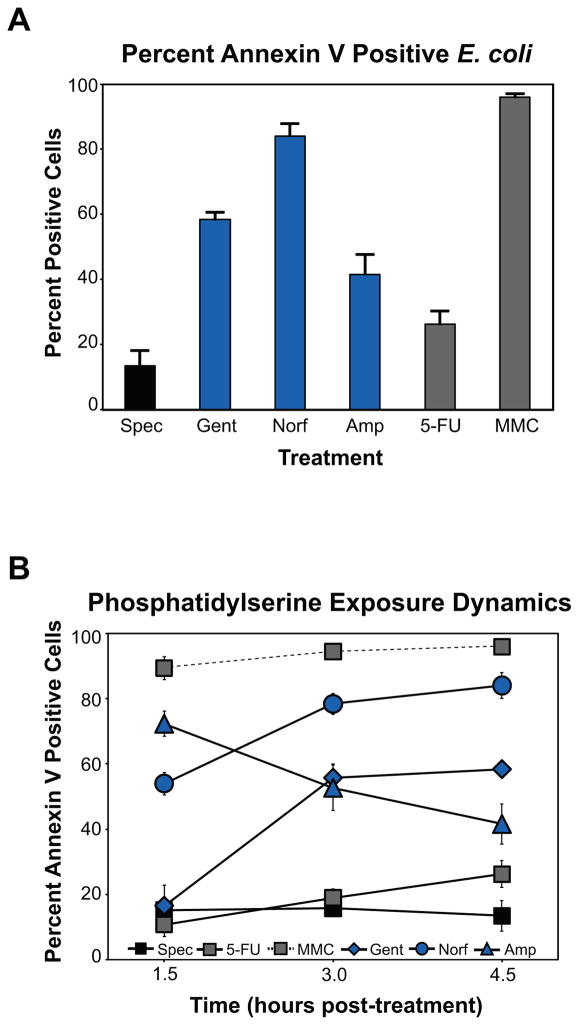
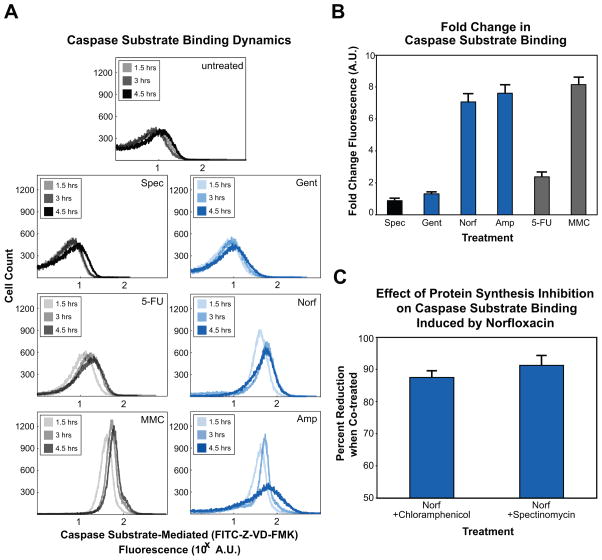
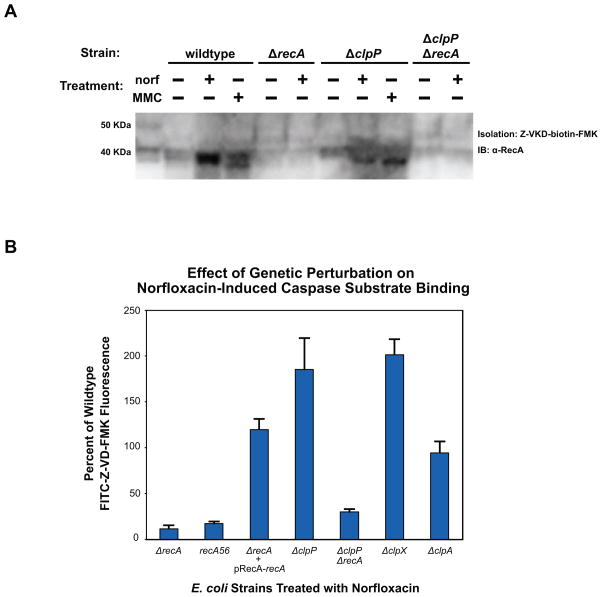
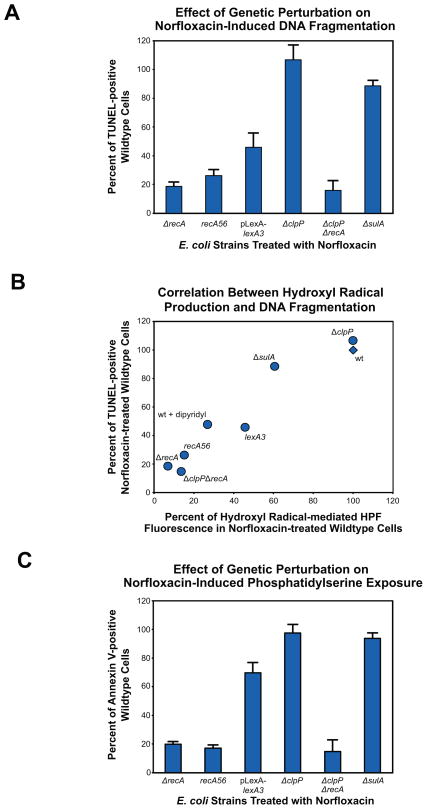
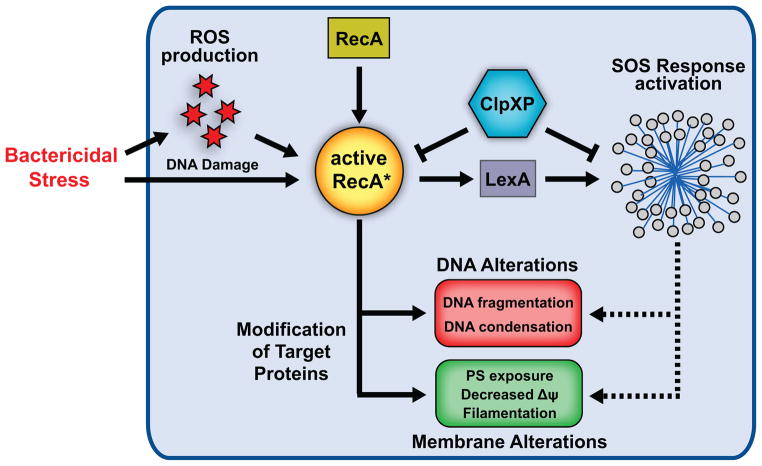
Programmed cell death is a gene-directed process involved in the development and homeostasis of multicellular organisms. The most common mode of programmed cell death is apoptosis, which is characterized by a stereotypical set of biochemical and morphological hallmarks. Here we report that Escherichia coli also exhibit characteristic markers of apoptosis-including phosphatidylserine exposure, chromosome condensation, and DNA fragmentation-when faced with cell death-triggering stress, namely bactericidal antibiotic treatment. Notably, we also provide proteomic and genetic evidence for the ability of multifunctional RecA to bind peptide sequences that serve as substrates for eukaryotic caspases, and regulation of this phenotype by the protease, ClpXP, under conditions of cell death. Our findings illustrate that prokaryotic organisms possess mechanisms to dismantle and mark dying cells in response to diverse noxious stimuli and suggest that elaborate, multilayered proteolytic regulation of these features may have evolved in eukaryotes to harness and exploit their deadly potential.


Figures

Figure 1
Figure 1. Cell death, DNA fragmentation and DNA condensation induced by bactericidal stress
(A) % culturable (mean ± SD) E. coli cells following treatment with gentamicin, norfloxacin, ampicillin, spectinomycin, mitomycin C, or 5-fluorouracil. Samples are taken when indicated and viable cells counted after 16 hours growth on solid media. (B) % TUNEL positive E. coli (mean ± SD at 4.5 hours post-treatment). Values reflect the mean percentage of a treated population exceeding the fluorescence of 99% of untreated cells, at each timepoint. (C) DNA fragmentation dynamics. Graph depicts mean ± SD percent TUNEL positive cells. (D) DNA fragmentation reduction via hydroxyl radical inhibition. % reduction in TUNEL positive E. coli (mean ± SD at 4.5 hours post-treatment) when co-treated with the iron chelator, dipyridyl. (E) Effect of drug treatment on the structural state of the E. coli chromosome and cellular morphology. Shown are representative bright-field and fluorescent (Hoechst 33342) micrographs of untreated and drug-treated cells at 4.5 hours post-treatment.
Figure 2
Figure 2. Phosphatidylserine exposure is induced by bactericidal stress
(A) % annexin V labeled E. coli (mean ± SD at 4.5 hours post-treatment) following bactericidal treatment. Shown are results for cells treated with spectinomycin, gentamicin, norfloxacin, ampicillin, 5-FU, or MMC. Values reflect the mean percentage of a treated population exceeding the fluorescence of 95% of untreated cells, at each timepoint. (B) PS exposure dynamics. Graph depicts mean ± SD percent annexin V labeled cells.
Figure 3
Figure 3. Bactericidal stress induces expression of a bacterial protein with affinity for caspase substrate peptides
(A) Representative flow cytometer fluorescence timecourse histograms of untreated cells and cells treated with spectinomycin, gentamicin, norfloxacin, ampicillin, 5-FU, or MMC. Increased FITC-Z-VD-FMK fluorescence indicates increased binding of this pan-caspase inhibitor to a bacterial protein with similar substrate specificity, identified as RecA. (B) Fold change in FITC-Z-VD-FMK fluorescence (mean ± SD at 4.5 hours post-treatment), relative to untreated wildtype cells. (C) Percent reduction in FITC-Z-VD-FMK fluorescence (mean ± SD at 4.5 hours post-treatment) when co-treated with norfloxacin and one of the protein synthesis inhibitors, chloramphenicol or spectinomycin.
Figure 4
Figure 4. Influence of RecA and ClpXP on caspase substrate binding
(A) RecA expression and caspase substrate binding assayed by western blot. Wildtype, ΔrecA, ΔclpP and ΔclpPΔrecA E. coli were treated with 125ng/mL norfloxacin or 0.5ug/mL MMC as shown, and samples taken at 4.5 hours post-treatment. Whole cell lysates were incubated with Z-VKD-biotin-FMK, then affinity purified with streptavidin and run on SDS-PAGE gels. Western blots were probed with a polyclonal E. coli RecA antibody. (B) % change in FITC-Z-VD-FMK fluorescence (mean ± SD at 4.5 hours post-treatment) exhibited by ΔrecA, ΔclpP, ΔclpPΔrecA, ΔclpX and ΔclpA E. coli when treated with 125ng/mL norfloxacin relative to similarly treated wildtype. Also shown is the effect of this treatment on ΔrecA cells expressing RecA from a rescue plasmid, and recA56 E. coli.
Figure 5
Figure 5. Influence of RecA, ClpP and the SOS response on DNA fragmentation, hydroxyl radical production and phosphatidylserine exposure
(A) % change in DNA fragmentation detectable by TUNEL (mean ± SD at 4.5 hours post-treatment) exhibited by ΔrecA, ΔclpP, ΔclpPΔrecA and ΔsulA cells, recA56 cells and wildtype E. coli expressing the LexA3(Ind-) mutant repressor protein compared to similarly treated wildtype cells (125ng/mL norfloxacin). (B) Correlation between norfloxacin-induced DNA fragmentation and hydroxyl radical production. Data reflect % change in DNA fragmentation detectable by TUNEL and hydroxyl radical production detectable by the fluorescent dye, HPF (mean ± SD at 4.5 hours post-treatment), compared to similarly treated wildtype cells (125ng/mL norfloxacin). (C) % change in PS exposure detectable by annexin V (mean ± SD at 4.5 hours post-treatments) exhibited by above strains compared to similarly treated wildtype cells (125ng/mL norfloxacin).
Figure 6
Figure 6. Physiological and biochemical hallmarks of apoptosis exhibited by terminally-stressed E. coli
Facing bactericidal stress, metabolic alterations fuel production of DNA-damaging reactive oxygen species (ROS), namely hydroxyl radicals (OH•), via the common mechanism of oxidative stress-related cell death. DNA damage induced by OH• alone, or in concert with the specific effects of the bactericidal stress, drives RecA to conformationally shift from its inactive to its active form. Following initial attempts to respond to this stress, namely SOS response network activation, E. coli exhibit several hallmarks of apoptosis which accompany cell death. These hallmarks include DNA fragmentation and condensation, and membrane alterations including PS exposure, decreased membrane potential ΔΨ, and cell division arrest [SulA-induced filamentation]. RecA plays a central role in the exhibition of these phenotypes, while the SOS response appears to play a downstream role in this process. Our findings also suggest that ClpXP affects the ability of RecA to induce these apoptotic phenotypes.

Comment in

References

    1. Ameisen JC. The origin of programmed cell death. Science. 1996;272:1278–1279. - PubMed
    1. Ameisen JC. On the origin, evolution, and nature of programmed cell death: a timeline of four billion years. Cell Death Differ. 2002;9:367–393. - PubMed
    1. Blackstone NW, Green DR. The evolution of a mechanism of cell suicide. Bioessays. 1999;21:84–88. - PubMed
    1. Boya P, Andreau K, Poncet D, Zamzami N, Perfettini JL, Metivier D, Ojcius DM, Jaattela M, Kroemer G. Lysosomal membrane permeabilization induces cell death in a mitochondrion-dependent fashion. J Exp Med. 2003;197:1323–1334. - PMC - PubMed
    1. Broker LE, Kruyt FA, Giaccone G. Cell death independent of caspases: a review. Clin Cancer Res. 2005;11:3155–3162. - PubMed

Publication types

MeSH terms