. 2012 Jun 19;22(12):1102-8.
doi: 10.1016/j.cub.2012.04.018. Epub 2012 May 24.

Transsynaptic control of presynaptic Ca²⁺ influx achieves homeostatic potentiation of neurotransmitter release

Affiliations

Transsynaptic control of presynaptic Ca²⁺ influx achieves homeostatic potentiation of neurotransmitter release

Martin Müller et al. Curr Biol. .

Abstract

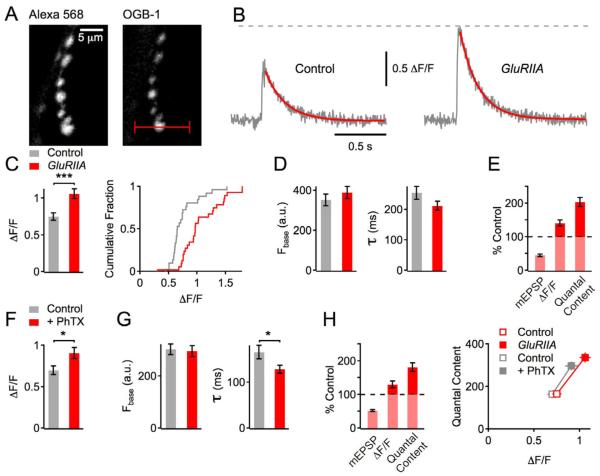
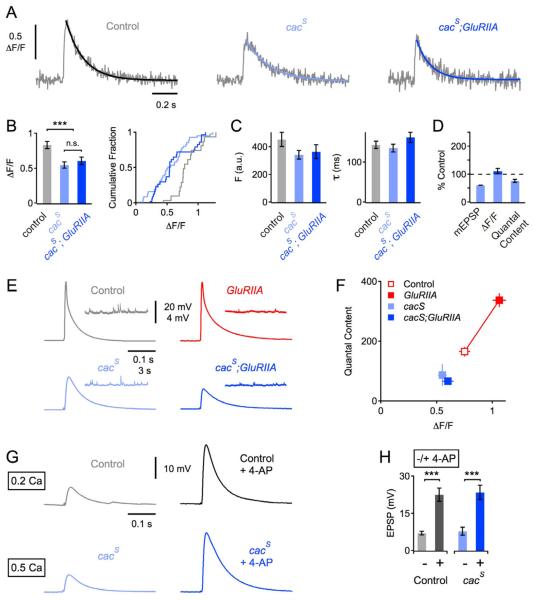
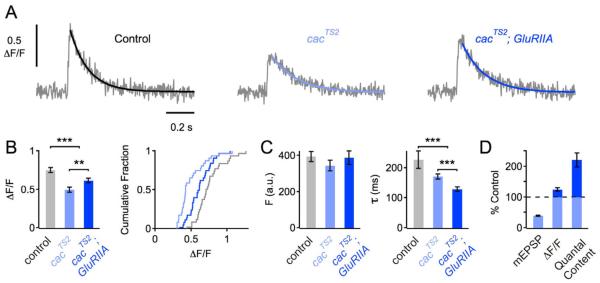
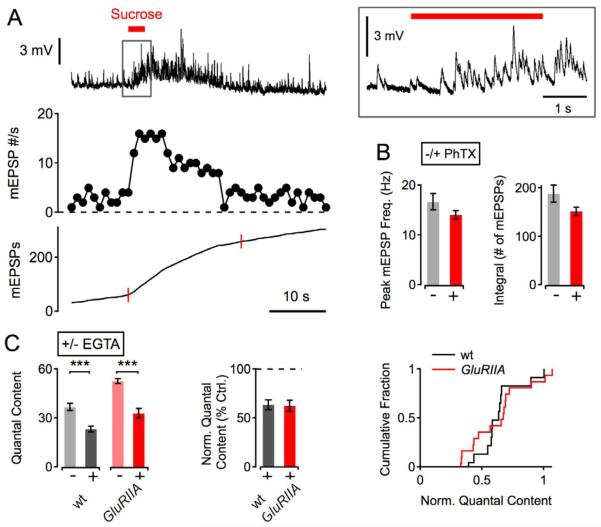
Given the complexity of the nervous system and its capacity for change, it is remarkable that robust, reproducible neural function and animal behavior can be achieved. It is now apparent that homeostatic signaling systems have evolved to stabilize neural function. At the neuromuscular junction (NMJ) of organisms ranging from Drosophila to human, inhibition of postsynaptic neurotransmitter receptor function causes a homeostatic increase in presynaptic release that precisely restores postsynaptic excitation. Here we address what occurs within the presynaptic terminal to achieve homeostatic potentiation of release at the Drosophila NMJ. By imaging presynaptic Ca(2+) transients evoked by single action potentials, we reveal a retrograde, transsynaptic modulation of presynaptic Ca(2+) influx that is sufficient to account for the rapid induction and sustained expression of the homeostatic change in vesicle release. We show that the homeostatic increase in Ca(2+) influx and release is blocked by a point mutation in the presynaptic CaV2.1 channel, demonstrating that the modulation of presynaptic Ca(2+) influx through this channel is causally required for homeostatic potentiation of release. Together with additional analyses, we establish that retrograde, transsynaptic modulation of presynaptic Ca(2+) influx through CaV2.1 channels is a key factor underlying the homeostatic regulation of neurotransmitter release.


Figures

Figure 1
Figure 1. Enhanced Presynaptic Ca2+ influx following acute or sustained disruption of postsynaptic glutamate receptor function
(A) Confocal images of boutons filled with Alexa 568 (left) and Oregon Green 488 BAPTA-1 (OGB-1, right) synapsing onto muscle 6 of a Drosophila NMJ. The red line indicates the location of the line scan. (B) Example traces of single AP-evoked, spatially-averaged Ca2+ transients measured by line scans of a wild-type control (left), and a GluRIIASP16 mutant synapse (right) (average of 10 scans each). The decays are fit with an exponential function (red). (C) Average Ca2+ transient peak amplitudes of (ΔF/F, see Experimental Procedures; left), and cumulative frequency plot of ΔF/F peak amplitudes (right) of control (n=26 boutons, gray) and GluRIIASP16 (n=28 boutons, red). Note the significant (p<0.001) increase in Ca2+ transient amplitude in GluRIIASP16 mutants compared to control. (D) Average baseline fluorescence (‘Fbase’) and decay time constant (‘τ’) of the groups introduced in (C). (E) Average mEPSP amplitude (‘mEPSP’), Ca2+-transient peak amplitude of (‘ΔF/F’), and quantal content (EPSP amplitude/mEPSP amplitude; see Experimental Procedures) of GluRIIASP16 mutants normalized to w1118 controls. Electrophysiology data of control (av. mEPSP=0.9±0.08 mV; EPSP=52.3±1.4 mV; n=9) and GluRIIASP16 group (av. mEPSP=0.4±0.04 mV; EPSP=51.4±2.2 mV; n=7) is in part based on a separate set of experiments. (F) Average ΔF/F peak amplitudes of control group (n=28 boutons; gray), and PhTX group (n=36 boutons, red). Note the significant (p=0.023) increase in Ca2+ transient amplitude after PhTX application. (G) Average baseline fluorescence (‘Fbase’) and decay time constant (‘τ’) of the data set introduced in (F). (H) Left: Average mEPSP amplitude, Ca2+-transient peak amplitude of (‘ΔF/F’), and quantal content after PhTX treatment normalized to controls. Electrophysiology data of control (av. mEPSP=0.9±0.1 mV; EPSP=48.3±1.7 mV; n=13) and PhTX group (av. mEPSP=0.47±0.03 mV; EPSP=51.2±2.6 mV; n=14) is in part based on a separate set of experiments. Right: Average quantal content (corrected for nonlinear summation; see Experimental Procedures) as a function of presynaptic Ca2+ transient peak amplitude (ΔF/F) of the indicated conditions and genotypes. Data are the same as in A – G. Data of experimental groups and control groups were collected side by side.
Figure 2
Figure 2. A Mutation in cacophony Blocks the Homeostatic Increase in Presynaptic Ca2+ Influx and Release
(A) Representative traces of spatially-averaged Ca2+ transients of the indicated genotypes (average of 8 – 12 scans each). (B) ΔF/F Ca2+ transient peak amplitudes (average and cumulative frequency plot) of control (n=18 boutons; gray), cacS (n=42; light blue), and cacS; GluRIIASP16 (n=30; dark blue). The peak amplitude of cacS mutants, and cacS; GluRIIASP16 double mutants was smaller than in control (both p<0.001), and there was no significant difference in peak amplitude between cacS mutants, and cacS; GluRIIASP16 (p=0.5). (C) Average baseline fluorescence (‘Fbase’) and decay time constant (‘τ’) of the groups introduced in (B). (D) Average mEPSP amplitude (‘mEPSP’), Ca2+-transient peak amplitude of (‘ΔF/F’), and quantal content of cacS; GluRIIASP16 double mutants normalized to cacS. (E) Example EPSP traces and mEPSP traces of the indicated genotypes. (F) Average quantal content as a function of presynaptic Ca2+ transient peak amplitude (ΔF/F) of the indicated genotypes. All data were collected at an extracellular Ca2+ concentration of 1 mM. Ca2+ imaging data is the same as introduced in (A – C), and electrophysiology data is in part based on a separate set of experiments (control: n=9; cacS: mEPSP=0.63±0.07 mV; EPSP=29.9±3.4 mV, n=4; cacS; GluRIIASP16: mEPSP=0.39±0.01 mV; EPSP=19.5±1.9 mV, n=7; GluRIIASP16: n=7; control and GluRIIASP16 data are also shown in Figure 1H). Note the supralinear relationship between quantal content and presynaptic Ca2+. (A linear fit to the logarithmized data gave a slope of 2.2; not shown), and the complete block of the homeostatic increase in presynaptic Ca2+ influx and release in cacS; GluRIIASP16 double mutants (dark blue). (G) Representative EPSPs of the indicated genotypes under control conditions (left), and in the continued presence of 50 mM of the K+-channel blocker 4-AP (right) at the indicated extracellular Ca2+ concentrations (in mM). (H) Average peak EPSP amplitudes in the absence (−) and presence (+) of 4-AP. Wild-type (−): n=10, wild-type (+): n=9; cacS (−): n=15; cacS (+): n=13. Note the difference in extracellular Ca2+ concentration between cacS (0.5 mM) and wild type (0.2 mM). There was no significant difference in the 4-AP-induced increase in EPSP amplitude between cacS and control (p=0.66).
Figure 3
Figure 3. Homeostatic Increase in Ca2+ Influx at cacTS2 Mutant Synapses
(A) Representative traces of spatially-averaged Ca2+ transients of the indicated genotypes (average of 8–12 scans each). (B) ΔF/F Ca2+ transient peak amplitudes (average and cumulative frequency plot) of control (n=31 boutons; gray), cacTS2 (n=32; light blue), and cacTS2; GluRIIASP16 (n=32; dark blue). All data were collected at room temperature. The peak amplitudes of cacTS2 mutants, and cacTS2; GluRIIASP16 double mutants were smaller than in control (both p<0.004), and there was a significant difference in peak amplitude between cacTS2 mutants, and cacTS2; GluRIIASP16 (p=0.007). Note that cacTS2; GluRIIASP16 double mutants display normal synaptic homeostasis at room temperature (see D) (Frank et al., 2006). (C) Average baseline fluorescence (‘Fbase’) and decay time constant (‘τ’) of the groups introduced in (B). (D) Average mEPSP amplitude (‘mEPSP’), Ca2+-transient peak amplitude of (‘ΔF/F’), and quantal content of cacTS2; GluRIIASP16 double mutants normalized to cacTS2. Electrophysiology data is based on a separate set of experiments (control: n=13; cacTS2: mEPSP=1.0±0.01 mV; EPSP=42.9±1.8 mV, n=15; cacTS2; GluRIIASP16: mEPSP=0.44±0.03 mV; EPSP=43.6±4.0 mV, n=8).
Figure 4
Figure 4. Sucrose-Sensitive Vesicle Pool and EGTA-Sensitivity of Release During Synaptic Homeostasis
(A) Example mEPSP trace (top), mEPSP frequency (mEPSP #/s; middle), and mEPSP integral (bottom; red bar) of a wild-type synapse during a sucrose challenge (top; 420 mM sucrose for 3 s). A magnified version of the mEPSP trace around the time of sucrose application is shown on the right (gray box). The mEPSP integral that was considered for analysis (a 20 s interval beginning at the onset of sucrose application) is highlighted by red marks (bottom trace). (B) Average peak mEPSP frequency (left) and mEPSP integral (right) of PhTX-treated synapses (n=15; red), and controls (n=8; gray). There was no significant difference in both parameters between PhTX-group and control group (both p>0.05). (C) Average quantal content of wild-type (‘wt’) and GluRIIASP16 mutants under control conditions (‘− EGTA’), and after EGTA-AM incubation (25 mM EGTA-AM for 10 minutes; see Experimental Procedures; ‘+ EGTA’). Average quantal content after EGTA incubation normalized to control (‘Norm. Quantal Content’, middle), and cumulative frequency histogram of normalized quantal content (right) in the absence (−) and presence (+) of EGTA-AM. wt (−): n=13; wt (+): n=12; GluRIIASP16 (−): n=15; GluRIIASP16 (+): n=18. EGTA application induced a similar decrease in quantal content in GluRIIASP16 mutants and control (p=0.91).

Similar articles

Cited by

References

    1. Bergquist S, Dickman DK, Davis GW. A Hierarchy of Cell Intrinsic and Target-Derived Homeostatic Signaling. Neuron. 2010;66:220–234. - PMC - PubMed
    1. Marder E, Goaillard J-M. Variability, compensation and homeostasis in neuron and network function. Nat Rev Neurosci. 2006;7:563–574. - PubMed
    1. Turrigiano GG, Nelson SB. Homeostatic plasticity in the developing nervous system. Nat Rev Neurosci. 2004;5:97–107. - PubMed
    1. Davis GW. Homeostatic control of neural activity: from phenomenology to molecular design. Annu. Rev. Neurosci. 2006;29:307–323. - PubMed
    1. Plomp JJ, van Kempen GT, Molenaar PC. Adaptation of quantal content to decreased postsynaptic sensitivity at single endplates in alpha-bungarotoxin-treated rats. J Physiol (Lond) 1992;458:487–499. - PMC - PubMed

Publication types

MeSH terms

Substances