

Functional activation of the infant cortex during object processing
- PMID: 22634218
- PMCID: PMC3457789
- DOI: 10.1016/j.neuroimage.2012.05.039
Functional activation of the infant cortex during object processing
Abstract
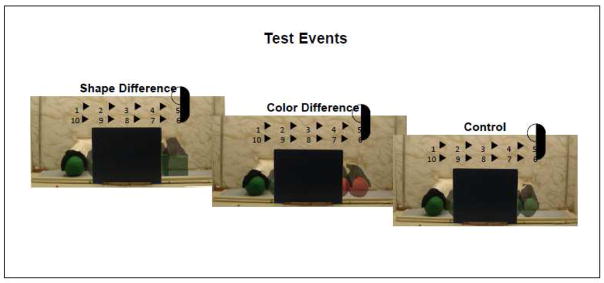
A great deal is known about the functional organization of the neural structures that mediate visual object processing in the adult observer. These findings have contributed significantly to our conceptual models of object recognition and identification and provided unique insight into the nature of object representations extracted from visual input. In contrast, little is known about the neural basis of object processing in the infant. The current research used near-infrared spectroscopy (NIRS) as a neuroimaging tool to investigate functional activation of the infant cortex during an object processing task that has been used extensively with infants. The neuroimaging data revealed that the infant cortex is functionally specialized for object processing (i.e., individuation-by-feature) early in the first year but that patterns of activation also change between 3 and 12 months. These changes may reflect functional reorganization of the immature cortex or age-related differences in the cognitive processes engaged during the task.
Copyright © 2012 Elsevier Inc. All rights reserved.
Figures


Similar articles
-
Using near-infrared spectroscopy to assess neural activation during object processing in infants.J Biomed Opt. 2005 Jan-Feb;10(1):11010. doi: 10.1117/1.1852551. J Biomed Opt. 2005. PMID: 15847576 Free PMC article.
-
Dissociation of processing of featural and spatiotemporal information in the infant cortex.Neuroimage. 2010 Dec;53(4):1256-63. doi: 10.1016/j.neuroimage.2010.06.064. Epub 2010 Jul 13. Neuroimage. 2010. PMID: 20603218 Free PMC article.
-
Cortical activation to object shape and speed of motion during the first year.Neuroimage. 2014 Oct 1;99:129-41. doi: 10.1016/j.neuroimage.2014.04.082. Epub 2014 May 10. Neuroimage. 2014. PMID: 24821531 Free PMC article.
-
Object processing in the infant: lessons from neuroscience.Trends Cogn Sci. 2015 Jul;19(7):406-13. doi: 10.1016/j.tics.2015.04.009. Epub 2015 May 22. Trends Cogn Sci. 2015. PMID: 26008625 Free PMC article. Review.
-
The emergence of top-down, sensory prediction during learning in infancy: A comparison of full-term and preterm infants.Dev Psychobiol. 2018 Jul;60(5):544-556. doi: 10.1002/dev.21624. Epub 2018 Apr 24. Dev Psychobiol. 2018. PMID: 29687654 Free PMC article. Review.
Cited by
-
Infants can use temporary or scant categorical information to individuate objects.Cogn Psychol. 2024 Mar;149:101640. doi: 10.1016/j.cogpsych.2024.101640. Epub 2024 Feb 26. Cogn Psychol. 2024. PMID: 38412626 Free PMC article.
-
Prefrontal Hemodynamics in Toddlers at Rest: A Pilot Study of Developmental Variability.Front Neurosci. 2017 May 30;11:300. doi: 10.3389/fnins.2017.00300. eCollection 2017. Front Neurosci. 2017. PMID: 28611578 Free PMC article.
-
[Near-infrared spectroscopy as an auxiliary tool in the study of child development].Rev Paul Pediatr. 2015 Apr-Jun;33(2):230-40. doi: 10.1016/j.rpped.2015.03.003. Epub 2015 Mar 20. Rev Paul Pediatr. 2015. PMID: 25862295 Free PMC article. Review.
-
Functional Activation in the Ventral Object Processing Pathway during the First Year.Front Syst Neurosci. 2016 Jan 5;9:180. doi: 10.3389/fnsys.2015.00180. eCollection 2015. Front Syst Neurosci. 2016. PMID: 26778979 Free PMC article.
-
Somatosensory evoked changes in cerebral oxygen consumption measured non-invasively in premature neonates.Neuroimage. 2014 Jan 15;85 Pt 1(0 1):279-86. doi: 10.1016/j.neuroimage.2013.01.035. Epub 2013 Jan 28. Neuroimage. 2014. PMID: 23370052 Free PMC article.
References
-
- Bartles A, Zeki S. The architecture of the colour centre in the human visual brain: New results and a review. European Journal of Neuroscience. 2000;12:172–193. - PubMed
-
- Biederman I. Recognition-by-components: A theory of human image. understanding. Psychological Review. 1987;94:115–147. - PubMed
-
- Born P, Leth H, Miranda MJ, Rostrup E, Stensgaard A, Peitersen B, Larsson HBW, Lou HC. Visual activation in infants and young children studied by functional magnetic resonance imaging. Pediatric Research. 1998;44:578–583. - PubMed
