

Metabotropic glutamate receptor 4 in the basal ganglia of parkinsonian monkeys: ultrastructural localization and electrophysiological effects of activation in the striatopallidal complex
- PMID: 22634360
- PMCID: PMC3490034
- DOI: 10.1016/j.neuropharm.2012.05.017
Metabotropic glutamate receptor 4 in the basal ganglia of parkinsonian monkeys: ultrastructural localization and electrophysiological effects of activation in the striatopallidal complex
Abstract
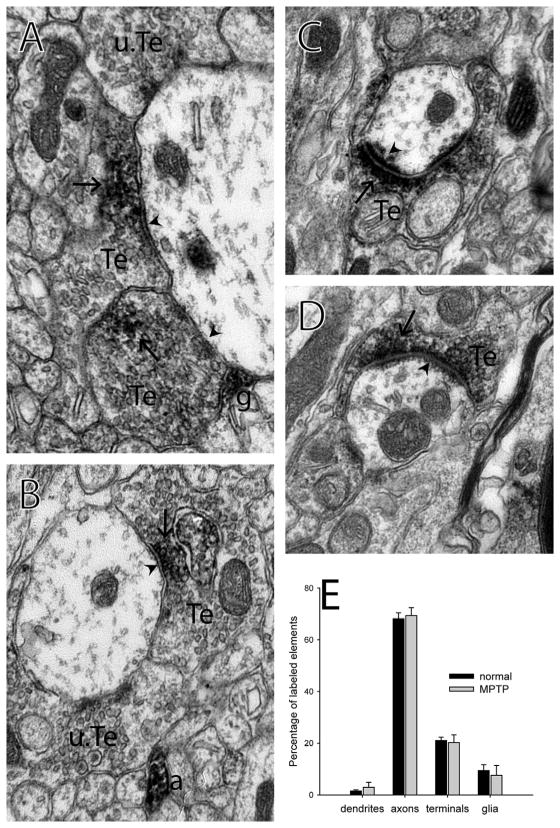
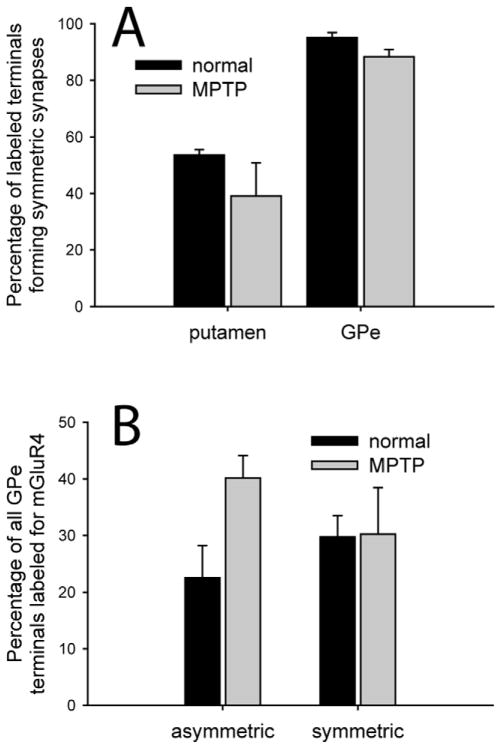
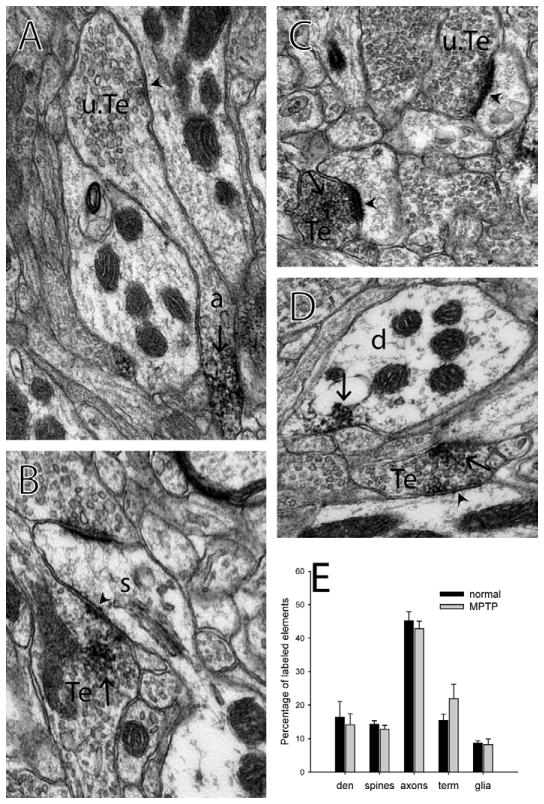
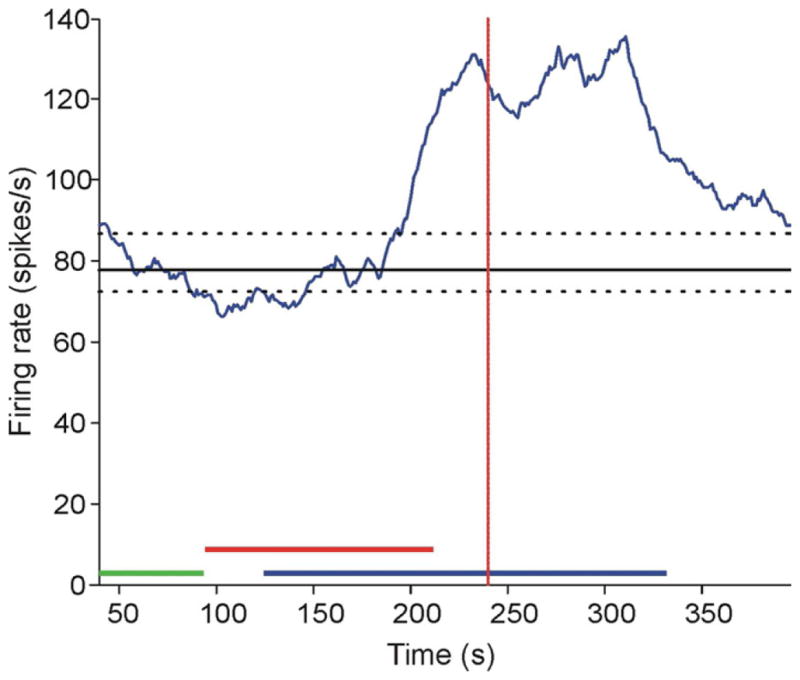
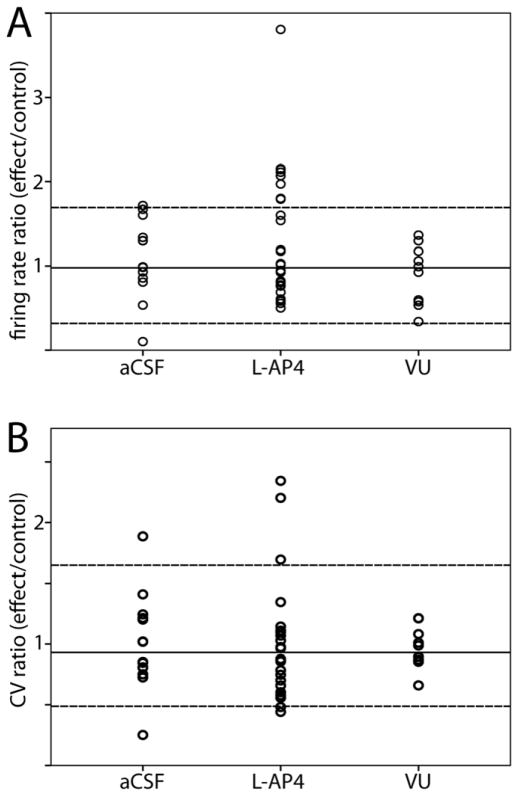
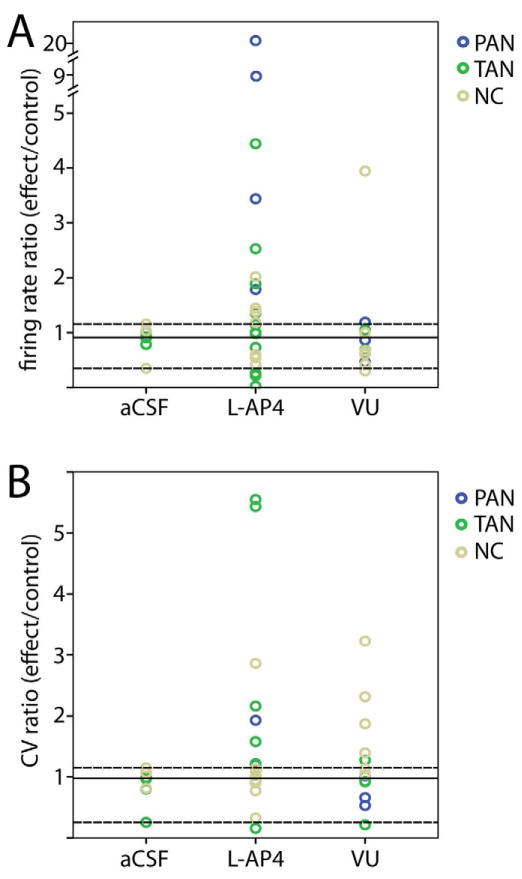
Group III metabotropic glutamate receptors (mGluR4,7,8) are widely distributed in the basal ganglia. Injection of group III mGluR agonists into the striatopallidal complex alleviates parkinsonian symptoms in 6-hydroxydopamine-treated rats. In vitro rodent studies have suggested that this may be partly due to modulation of synaptic transmission at striatopallidal and corticostriatal synapses through mGluR4 activation. However, the in vivo electrophysiological effects of group III mGluRs activation upon basal ganglia neurons activity in nonhuman primates remain unknown. Thus, in order to examine the anatomical substrates and physiological effects of group III mGluRs activation upon striatal and pallidal neurons in monkeys, we used electron microscopy immunohistochemistry to localize mGluR4, combined with local administration of the group III mGluR agonist L-AP4, or the mGluR4 positive allosteric modulator VU0155041, to assess the effects of group III mGluR activation on the firing rate and pattern of striatal and pallidal neurons in 1-methyl-4-phenyl-1,2,3,6-tetrahydropyridine (MPTP)-treated parkinsonian monkeys. At the ultrastructural level, striatal mGluR4 immunoreactivity was localized in pre- (60%) and post-synaptic (30%) elements, while in the GPe, mGluR4 was mainly expressed pre-synaptically (90%). In the putamen, terminals expressing mGluR4 were evenly split between putative excitatory and inhibitory terminals, while in the GPe, most labeled terminals displayed the ultrastructural features of striatal-like inhibitory terminals, though putative excitatory boutons were also labeled. No significant difference was found between normal and parkinsonian monkeys. Extracellular recordings in awake MPTP-treated monkeys revealed that local microinjections of small volumes of L-AP4 resulted in increased firing rates in one half of striatal cells and one third of pallidal cells, while a significant number of neurons in both structures showed either opposite effects, or did not display any significant rate changes following L-AP4 application. VU0155041 administration had little effect on firing rates. Both compounds also had subtle effects on bursting and oscillatory properties, acting to increase the irregularity of firing. The occurrence of pauses in firing was reduced in the majority (80%) of GPe neurons after L-AP4 injection. Our findings indicate that glutamate can mediate multifarious physiological effects upon striatal and pallidal neurons through activation of pre-synaptic group III mGluRs at inhibitory and excitatory synapses in parkinsonian monkeys. This article is part of a Special Issue entitled 'Metabotropic Glutamate Receptors'.
Copyright © 2012 Elsevier Ltd. All rights reserved.
Figures
Similar articles
-
Group III metabotropic glutamate receptor-mediated modulation of the striatopallidal synapse.J Neurosci. 2003 Aug 6;23(18):7218-26. doi: 10.1523/JNEUROSCI.23-18-07218.2003. J Neurosci. 2003. PMID: 12904482 Free PMC article.
-
Electrophysiological and behavioral effects of group III metabotropic glutamate receptors on pallidal neurons in normal and parkinsonian rats.Synapse. 2013 Dec;67(12):831-8. doi: 10.1002/syn.21694. Epub 2013 Jul 27. Synapse. 2013. PMID: 23813476
-
Distinct effects of mGlu4 receptor positive allosteric modulators at corticostriatal vs. striatopallidal synapses may differentially contribute to their antiparkinsonian action.Neuropharmacology. 2014 Oct;85:166-77. doi: 10.1016/j.neuropharm.2014.05.025. Epub 2014 May 24. Neuropharmacology. 2014. PMID: 24866785
-
GABA(B) and group I metabotropic glutamate receptors in the striatopallidal complex in primates.J Anat. 2000 May;196 ( Pt 4)(Pt 4):555-76. doi: 10.1046/j.1469-7580.2000.19640555.x. J Anat. 2000. PMID: 10923987 Free PMC article. Review.
-
An influence of ligands of metabotropic glutamate receptor subtypes on parkinsonian-like symptoms and the striatopallidal pathway in rats.Amino Acids. 2007 Feb;32(2):179-88. doi: 10.1007/s00726-006-0317-y. Epub 2006 May 15. Amino Acids. 2007. PMID: 16699817 Review.
Cited by
-
Pharmacological stimulation of metabotropic glutamate receptor type 4 in a rat model of Parkinson's disease and L-DOPA-induced dyskinesia: Comparison between a positive allosteric modulator and an orthosteric agonist.Neuropharmacology. 2015 Aug;95:121-9. doi: 10.1016/j.neuropharm.2015.02.023. Epub 2015 Mar 4. Neuropharmacology. 2015. PMID: 25749357 Free PMC article.
-
Structural plasticity of GABAergic and glutamatergic networks in the motor thalamus of parkinsonian monkeys.J Comp Neurol. 2020 Jun;528(8):1436-1456. doi: 10.1002/cne.24834. Epub 2019 Dec 16. J Comp Neurol. 2020. PMID: 31808567 Free PMC article.
-
The Metabotropic Glutamate Receptor 4 Positive Allosteric Modulator ADX88178 Inhibits Inflammatory Responses in Primary Microglia.J Neuroimmune Pharmacol. 2016 Jun;11(2):231-7. doi: 10.1007/s11481-016-9655-z. Epub 2016 Feb 12. J Neuroimmune Pharmacol. 2016. PMID: 26872456 Free PMC article.
-
mGluR4-containing corticostriatal terminals: synaptic interactions with direct and indirect pathway neurons in mice.Brain Struct Funct. 2016 Dec;221(9):4589-4599. doi: 10.1007/s00429-016-1187-z. Epub 2016 Jan 30. Brain Struct Funct. 2016. PMID: 26832920 Free PMC article.
-
Glutamatergic mechanisms in L-DOPA-induced dyskinesia and therapeutic implications.J Neural Transm (Vienna). 2018 Aug;125(8):1225-1236. doi: 10.1007/s00702-018-1846-8. Epub 2018 Jan 31. J Neural Transm (Vienna). 2018. PMID: 29387966
References
-
- Blazquez PM, Fujii N, Kojima J, Graybiel AM. A network representation of response probability in the striatum. Neuron. 2002;33:973–982. - PubMed
-
- Beurrier C, Lopez S, Revy D, Selvam C, Goudet C, Lherondel M, Gubellini P, Kerkerian-LeGoff L, Acher F, Pin JP, Amalric M. Electrophysiological and behavioral evidence that modulation of metabotropic glutamate receptor 4 with a new agonist reverses experimental parkinsonism. FASEB J. 2009;23:3619–3628. - PubMed
-
- Blandini F, Greenamyre JT. Prospects of glutamate antagonists in the therapy of Parkinson’s disease. Fundam Clin Pharmacol. 1998;12:4–12. - PubMed
-
- Blandini F, Greenamyre JT, Nappi G. The role of glutamate in the pathophysiology of Parkinson’s disease. Funct Neurol. 1996;11:3–15. - PubMed
Publication types
MeSH terms
Substances
Grants and funding
LinkOut - more resources
Full Text Sources
Other Literature Sources
