. 2012 May 27;30(6):531-42.
doi: 10.1038/nbt.2239.

Isolation of primitive endoderm, mesoderm, vascular endothelial and trophoblast progenitors from human pluripotent stem cells

Affiliations

Isolation of primitive endoderm, mesoderm, vascular endothelial and trophoblast progenitors from human pluripotent stem cells

Micha Drukker et al. Nat Biotechnol. .

Abstract

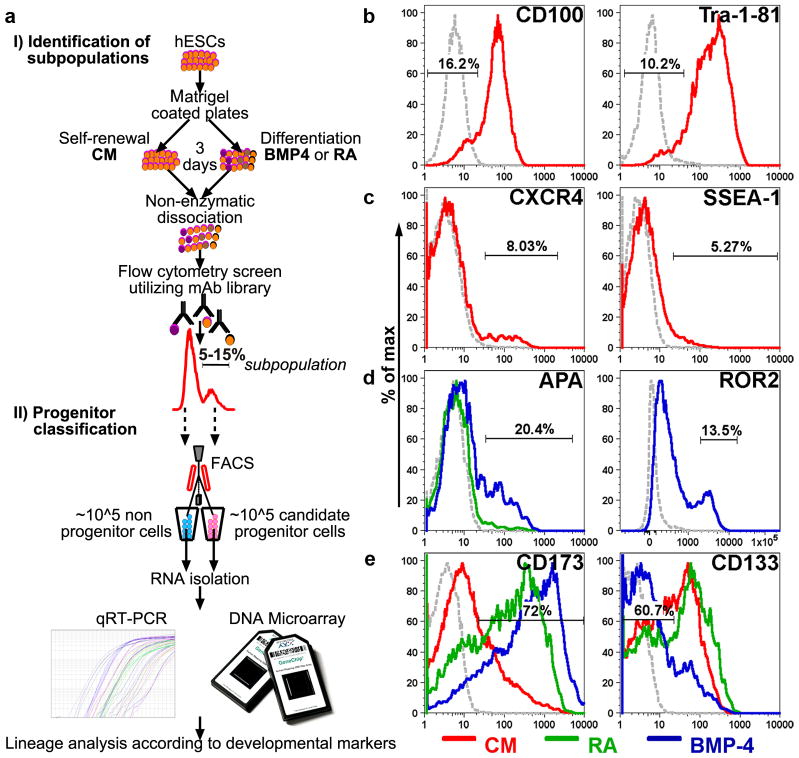
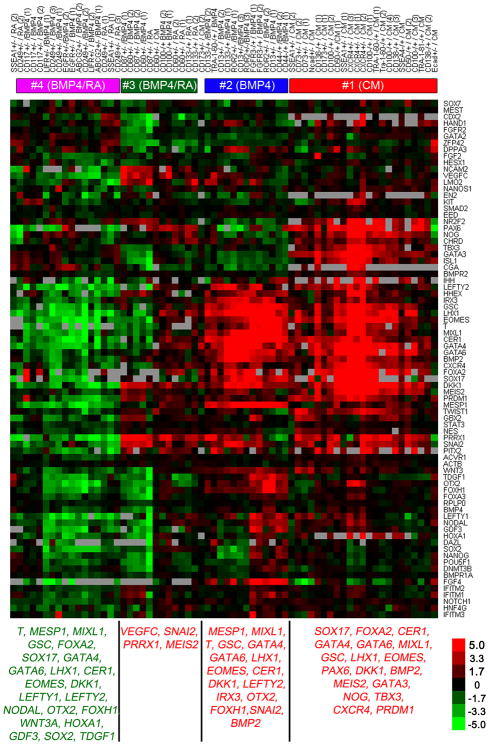
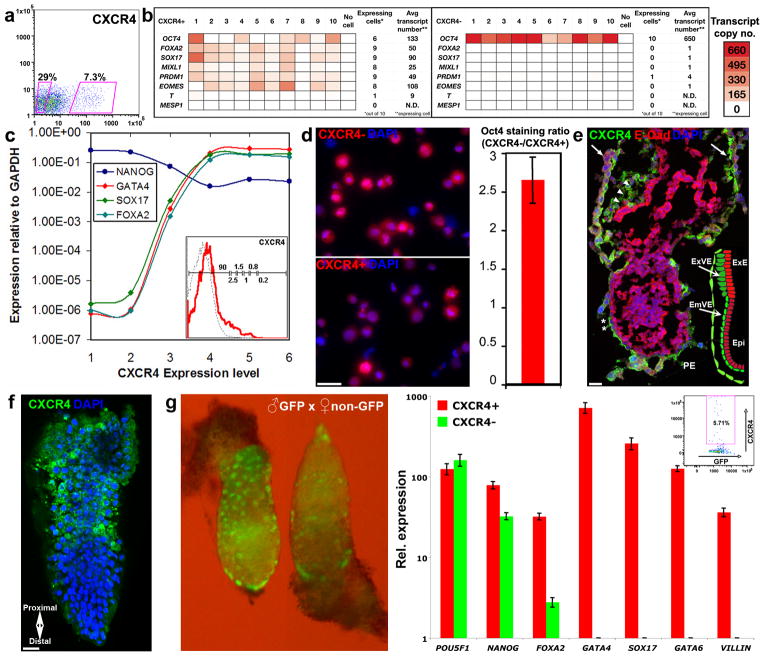
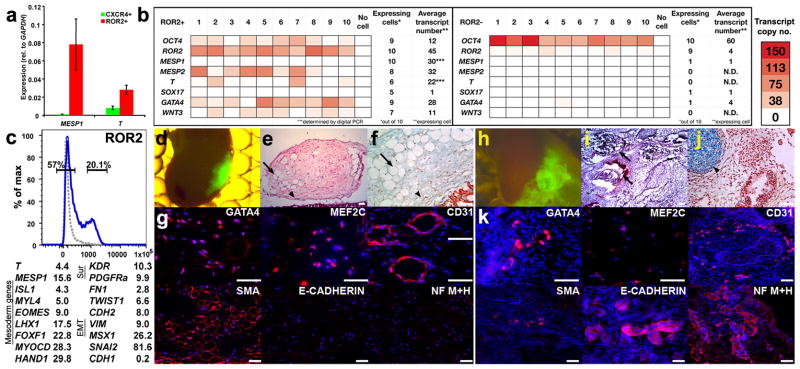
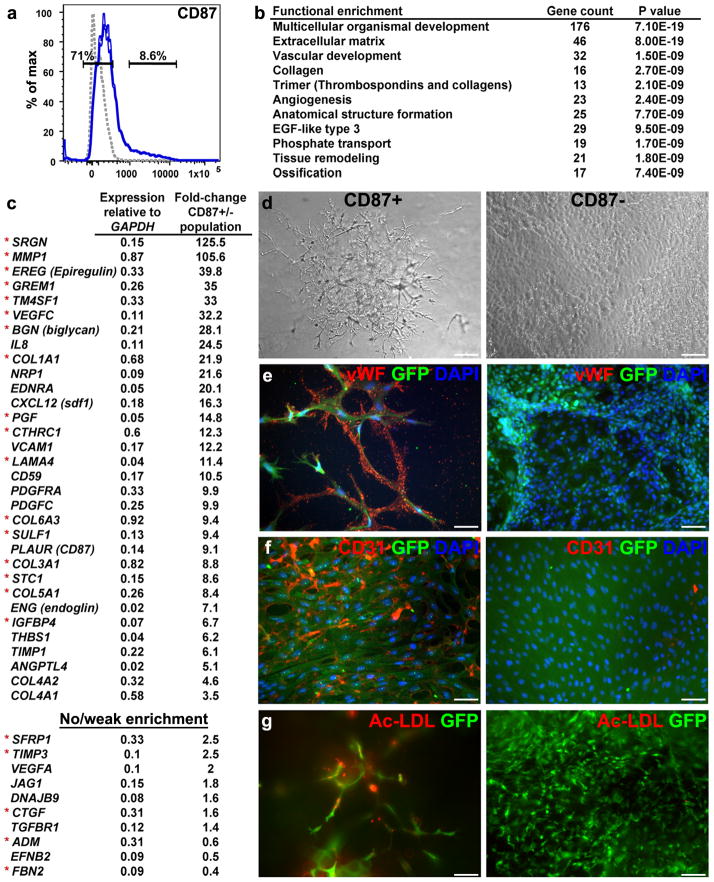
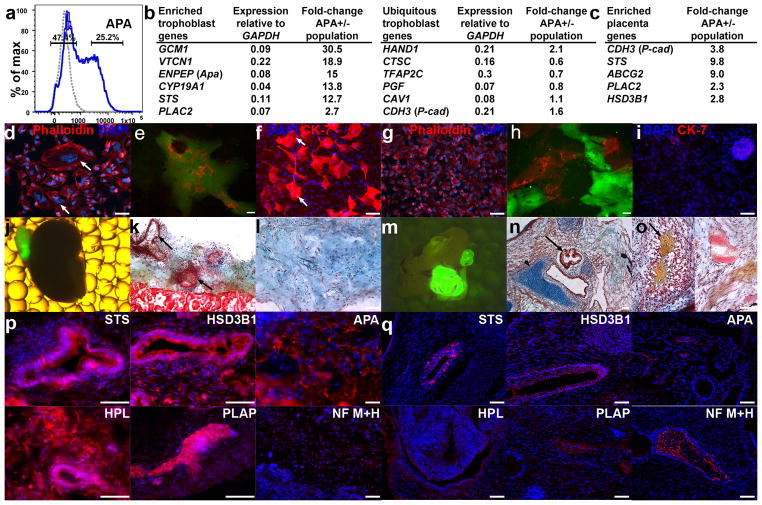
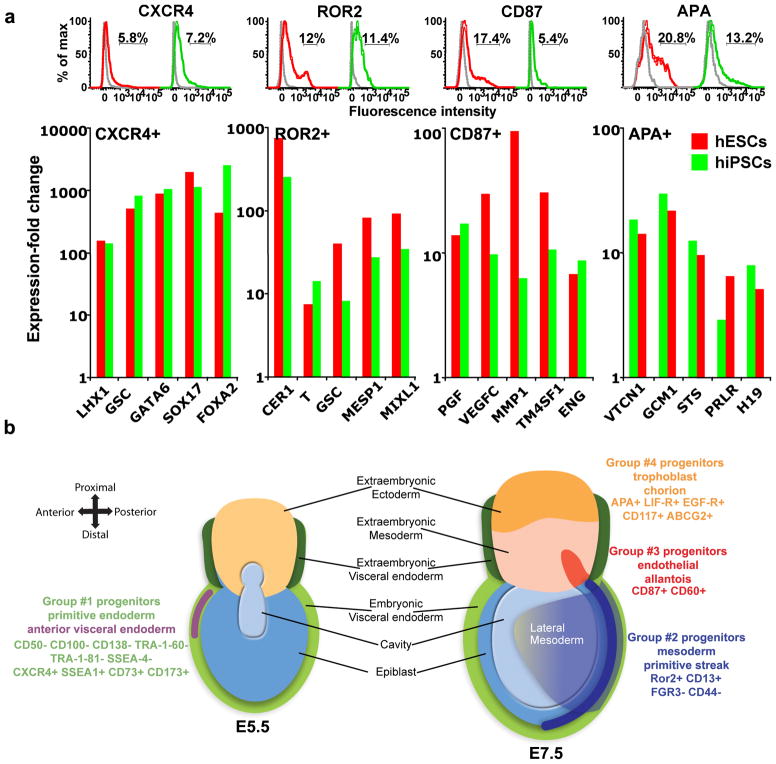
To identify early populations of committed progenitors derived from human embryonic stem cells (hESCs), we screened self-renewing, BMP4-treated and retinoic acid-treated cultures with >400 antibodies recognizing cell-surface antigens. Sorting of >30 subpopulations followed by transcriptional analysis of developmental genes identified four distinct candidate progenitor groups. Subsets detected in self-renewing cultures, including CXCR4(+) cells, expressed primitive endoderm genes. Expression of Cxcr4 in primitive endoderm was confirmed in visceral endoderm of mouse embryos. BMP4-induced progenitors exhibited gene signatures of mesoderm, trophoblast and vascular endothelium, suggesting correspondence to gastrulation-stage primitive streak, chorion and allantois precursors, respectively. Functional studies in vitro and in vivo confirmed that ROR2(+) cells produce mesoderm progeny, APA(+) cells generate syncytiotrophoblasts and CD87(+) cells give rise to vasculature. The same progenitor classes emerged during the differentiation of human induced pluripotent stem cells (hiPSCs). These markers and progenitors provide tools for purifying human tissue-regenerating progenitors and for studying the commitment of pluripotent stem cells to lineage progenitors.


Conflict of interest statement

COMPETINGFINANCIAL INTERESTS

The authors declare no competing financial interests

Figures

Figure 1
Figure 1
Identification of cell surface markers expressed by candidate progenitor populations. (a) A scheme of the approach for systematic identification of hESC-derived progenitors, including: (i) flow cytometry-based screen of candidate progenitor populations in self-renewing and differentiating (BMP4- or retinoic acid–treated) cultures, and (ii) lineage analysis based on expression of ~100 early embryonic genes and genome-wide transcriptional profiling. (be) Representative FACS plots for few of the markers (Percentages of subpopulations are shown). (b) Labeling of CM-treated cells with novel and established markers of undifferentiated cells (CD100 and Tra-1–81, respectively) revealed negative subpopulations of putative progenitors. (c) CXCR4+ and SSEA-1+ subpopulations within CM-treated cultures. (d) APA and ROR2 are expressed by emerging progenitor populations in BMP4-treated cultures. (e) CD173 and CD133 expression profiles reveal large population shifts in response to treatments with BMP4 and retinoic acid. Red, green and blue lines correspond to CM, retinoic acid and BMP4 treatments, respectively. Gray dotted lines are isotype controls.
Figure 2
Figure 2
Analysis of gene expression profiles in sorted hESC-derived populations. Each column represents an individual sort and each row corresponds to a developmental gene. Red and green values represent, respectively, higher and lower level of gene expression in the progenitor population versus cells exhibiting the opposite pattern of staining (inverse population). Cell surface marker and treatment of each sort are indicated at the top. +/− denotes analysis of gene expression in a progenitor population positive for the marker versus the respective non-progenitor negative cells, and −/+ denotes analysis of a progenitor population negative for the marker versus the respective non-progenitor positive cells. CM, BMP4 and retinoic acid (RA) indicate the culture treatment that preceded isolation. Most sorts were performed three times using cells at different passages. Biological repeat number is indicated in parenthesis. Four primary progenitor groups were identified based on similarities in gene expression cohorts measured in each population. Numbers in the top bars denote association of the sorted populations with the four progenitor groups indicated in Supplementary Figure 2. Bottom lists summarize genes that exhibited higher (red) or lower (green) expression in the main four progenitor groups versus the inverse populations. Red labeled genes also exhibited high absolute expression (within 6 qRT-PCR cycles from GAPDH).
Figure 3
Figure 3
Primitive endoderm characteristics of CXCR4+ cells representing progenitor group no. 1. (a) Gates for sorting CXCR4+ and CXCR4 cells from CM-treated 3-day cultures. (b) Representative analysis of differentiation and pluripotency genes in ten single CXCR4+ (left) and CXCR4 cells (right) sorted from CM-treated cultures. Transcript copy numbers of GAPDH and OCT4 in single CXCR4 cells were determined by “Digital PCR”. Copy numbers of the remaining genes (displayed as red color-coded sectors) were estimated based on the respective difference in qRT-PCR cycles between each gene and GAPDH (used as a reference gene). Genes were said to be “expressed” if their estimated transcript number exceeded 2 copies per cell. “N.D.” denotes undetectable levels. (c) Analysis of endoderm (SOX17, FOXA2, GATA4) and pluripotency (NANOG) genes in single cells fractionated by six sorting gates along the intensity axis of CXCR4 (averaged across 4–7 cells in each group, CM-treated cells). Inset displays the histogram of CXCR4 levels with the respective sorting gates (1 through 6). (d) Immunohistochemistry of OCT4 protein in CXCR4 (top) and CXCR4+ cells (bottom) sorted from CM-treated cultures. Quantitative analysis of staining intensity across 10 fields of single cells revealed ~2.7-fold higher OCT4 levels in CXCR4 relative to CXCR4+ cells (right), confirming moderate reduction in the level of pluripotency factors in single CXCR4+ cells. (e) Immunohistochemistry of Cxcr4 (green) and E-cadherin (red) in E6.5 mouse embryos. Note the staining of cells within primitive endoderm tissues, including the parietal endoderm (arrows), and the extra embryonic and embryonic portions of the visceral endoderm (arrowheads and asterisks, respectively). E-cadherin staining was confined to the epiblast. Inset diagram shows the locations of anterior primitive endoderm and epiblast in E6.5 mouse embryos. (f) Whole mount immunohistochemical analysis of Cxcr4 (green) in E6.5 mouse epiblast revealed membrane staining at the extra embryonic proximal region. DAPI staining is shown in blue. Scale bars = 25 μm. (g) Left: GFP+ E6.5 mouse embryos produced by mating C57BL6/Ka GFP males with C57BL6/Ka Wt females. Right: Relative expression of pluripotency and endoderm genes measured by qRT-PCR in single sorted (inset) GFP+Cxcr4+ and GFP+Cxcr4 cells (averaged across 2–8 cells). Error bars represent s.e.m.
Figure 4
Figure 4
ROR2+ progenitors (representing group no. 2) exhibit characteristics of embryonic mesoderm and generate mesoderm tissues in vivo. (a) Levels of the mesoderm genes, MESP1 and T, in ROR2+ versus CXCR4+ progenitors sorted, respectively, from BMP4-treated and CM-treated cultures. Error bars represent s.e.m. (b) Representative analysis of differentiation and pluripotency genes in ten single ROR2+ (left) and ROR2 cells (right) sorted from 3-day BMP4-treated embryoid bodies. Transcript copy number of GAPDH was determined by Digital PCR. Copy numbers of the remaining genes (displayed as red color-coded sectors) were estimated based on the respective difference in qRT-PCR cycles between each gene and GAPDH. Genes were said to be “expressed” if their estimated transcript number exceeded 2 per cell. (***) Average copy numbers of T and MESP1 in ROR2+ cells were determined based on single cell measurements using Digital PCR. “N.D.” denotes undetectable levels. (c, top) Gating strategy for sorting ROR2+ and ROR2 cells from 3-day BMP4-treated cultures (isotype control shown as gray dotted line). (c, bottom) Expression fold-difference of representative mesoderm, lateral mesoderm, and epithelial-to-mesenchymal transition (EMT) genes in ROR2+ versus ROR2 populations that were cultured for 7 more days in the presence of FBS (based on an average of two genome-wide profiling experiments conducted with cultures at different passages). (d,h) Ectopic cell masses formed by sorted GFP-labeled ROR2+ (d) and ROR2 cells (h) 8 weeks following sub-capsular renal transplantation. (e,i) Low-power microphotographs of Hematoxylin and Eosin (H&E) stained ROR2+ (e) and ROR2 graft sections (i). (f,j) High magnification microphotographs of pentachrome-stained sections from ROR2+ (f) and ROR2 grafts (j). Light blue denotes heparan sulfate–rich region. Intense blue corresponds to cartilage. (e,f) ROR2+ grafts contained numerous vascular (arrows) and mesenchyme structures (arrowheads) with no evidence of epithelium, cartilage, or ossification. (hj) ROR2 grafts were substantially larger (h) and contained epithelial structures (arrows, i) and cartilage (arrowheads, j). (g) Positive immunostaining of large portions of ROR2+ grafts with a panel of antibodies recognizing the mesoderm markers, GATA4, myocyte-specific enhancer factor 2C (MEF2C), platelet endothelial cell adhesion molecule (PECAM1, CD31) and smooth muscle actin (SMA). In contrast, the neuronal markers (medium and heavy neurofilament chains; NF M+H) and the epithelial marker, E-cadherin, were not detected in these grafts. (k) Similar analysis in ROR2 grafts revealed GATA4 and MEF2C staining only in a small number of cells. Likewise, CD31 and SMA were expressed in localized regions in the ROR2 graft. In contrast, NF M+H and E-cadherin were widely expressed. DAPI staining of DNA is show in blue. Scale bars, 25 μm.
Figure 5
Figure 5
CD87+ progenitors (representing group no. 3) exhibit characteristics of endothelial microvasculature. (a) Gates for sorting CD87+ and CD87 cells from 5-day BMP4-treated cultures (isotype control shown as gray dotted line). (b) Gene ontology analysis indicating enrichment of gene categories in CD87+ relative to CD87 populations, based on 726 genes that were differentially expressed over threefold in CD87+ cells. (c) Partial list of vascular- and angiogenesis-related genes expressed at higher levels in CD87+ versus CD87 populations (top). Red asterisks denote genes that are also expressed at higher levels in the microvascular dermal endothelial cell line HMEK-1, compared with the tubular epithelial cell line HK-2 (ref. 33). Partial list of vasculogenesis-related genes that are expressed at medium to high levels in both CD87+ and CD87 populations is shown at the bottom. Analyses in (b,c) are based on an average of two genome-wide profiling experiments with cultures at different passages. (dg) Developmental potential of sorted, GFP-tagged CD87+ and CD87 populations, analyzed following additional culturing period of 7 d in FBS containing media. (d) Representative phase-contrast photomicrographs show development of microvascular networks in the CD87+ but not in CD87 cultures. (e,f) Immunohistochemistry with von Willebrand factor and CD31 antibodies revealed specific staining (red) only in vesicles (e) and membranes (f) within the CD87+ cultures. Green label corresponds to GFP as detected by immunostaining. DAPI staining is shown in blue. (g) Fluorescence photomicrograph of Ac-LDL uptake (red) revealed positive signal only in CD87+ cells. Scale bars, 25 μm.
Figure 6
Figure 6
APA+ progenitors (representing group no. 4) exhibit trophoblast characteristics and produce syncytiotrophoblasts by cell fusion. (a) Gates for sorting APA+ and APA cells from 3.5-day BMP-treated cultures (isotype control shown as gray dotted line). (b) Partial list of syncytiotrophoblast- and placenta-related genes expressed at higher levels in APA+ versus APA cells (left). Right: placental genes expressed at medium to high levels in both APA+ and APA cells. (c) Expression fold-difference of representative trophoblast and placental genes in APA+ versus APA populations that were sorted at day 3.5 and cultured for additional 7 d in the presence of FBS. (b,c) Analyses are based on an average of two genome-wide profiling experiments with cultures at different passages. (di) Formation of syncytiotrophoblasts by fusion of sorted APA+, but not APA cells. (d,g) TexRed-conjugated phalloidin (red) and DAPI staining (blue) of APA+ (d) and APA cells (g) that were cultured in the presence of FBS for 5 d. Multinucleated cells were almost exclusive to the APA+ culture (arrows). (e,h) Mixture of GFP-labeled and mCherry-labeled APA+ (e) and APA cells (h) that were cultured for 7 d. Multinucleated cells that are positive for both GFP and mCherry were enriched in the APA+ (e) compared with APA culture (h). (f,i) Immunohistochemistry of GFP-labeled APA+ and APA cells with the pan-trophoblast marker Cytokeratin 7 after culturing for 7 d with FBS revealed multinucleated Cytokeratin 7 positive cells only in the APA+ culture (f vs. i); GFP was detected by immunostaining. (j,m) Ectopic cell masses formed from sorted GFP-labeled APA+ (j) and APA (m) hESC-derived populations 8 weeks following sub-capsular renal transplantation. Low (k,n) and high (l,o) magnification microphotographs of pentachrome-stained sections from APA+ (k,l) and APA (n,o) grafts (light blue, heparan sulfate–rich region; intense blue, cartilage; greenish blue calcified cartilage; yellow, bone). APA+ grafts (k,l) consisted primarily of mesenchyme (light blue) and epithelial structures (arrows in k) with no evidence of cartilage, ossification, or fibroblasts. Host kidney structure is shown at the bottom (k). In contrast, APA grafts were substantially larger (m) and contained epithelial structures (n) including gut epithelium-like structures (arrow), cartilage (arrowhead), and calcified cartilage (evidence of bone formation in o, arrow). (p,q) Immunohistochemistry of APA+ (p) and APA grafts (q) with a panel of antibodies recognizing placental markers, including: steroid sulfatase (STS), hydroxy-delta-5-steroid dehydrogenase, 3 beta- and steroid delta-isomerase 1 (HSD3B1), Aminopeptidase A (APA, CD249), human chorionic somatomammotropin hormone 1 (Human placental lactogen, HPL), and placental alkaline phosphatase (PLAP). (p) APA+ grafts contained numerous cells expressing STS, HSD3B1, APA, HPL and PLAP but were negative for NF M+H. (q) The placental markers STS, HSD3B1, and PLAP were limited to small regions of the APA grafts and HPL signal was marginal. On the other hand, NF M+H chains were detected in large regions of APA grafts. DAPI staining is shown in blue. Scale bars, 25 μm.
Figure 7
Figure 7
Similarities between hESC- and hiPSC-derived progenitors and their suggested correspondence to pre- and gastrulation-stage mouse embryonic precursors. (a) Flow cytometry analyses of CXCR4, ROR2, CD87 and APA expression in dissociated hESCs (red) and hiPSCs (green) revealed similar-sized populations in both sources (top). Gray lines represent isotype controls. Bottom: mRNA expression fold-change profiles in CXCR4+, ROR2+, CD87+ and APA+ populations versus the respective negative populations sorted from hESCs (red) and hiPSCs (green). CXCR4+ cells were isolated from CM-treated cultures, while ROR2, CD87, and APA cells were isolated from BMP4-treated cultures. Analysis is based on two experiments conduced with cells at different passages. (b) Proposed correspondence of progenitor groups no. 1–4 to E5.5 (left) and E7.5 (right) mouse embryos. The human cell surface markers of each progenitor group are listed.

Comment in

  • Taming stem cell heterogeneity.
    de Souza N. de Souza N. Nat Methods. 2012 Jul;9(7):645. doi: 10.1038/nmeth.2094. Nat Methods. 2012. PMID: 22930832 No abstract available.

Similar articles

Cited by

References

    1. Murry CE, Keller G. Differentiation of embryonic stem cells to clinically relevant populations: lessons from embryonic development. Cell. 2008;132:661–680. - PubMed
    1. Xu RH, et al. BMP4 initiates human embryonic stem cell differentiation to trophoblast. Nat Biotechnol. 2002;20:1261–1264. - PubMed
    1. Bernardo AS, et al. BRACHYURY and CDX2 mediate BMP-induced differentiation of human and mouse pluripotent stem cells into embryonic and extraembryonic lineages. Cell Stem Cell. 2011;9:144–155. - PMC - PubMed
    1. D’Amour KA, et al. Efficient differentiation of human embryonic stem cells to definitive endoderm. Nat Biotechnol. 2005;23:1534–1541. - PubMed
    1. Yasunaga M, et al. Induction and monitoring of definitive and visceral endoderm differentiation of mouse ES cells. Nat Biotechnol. 2005;23:1542–1550. - PubMed

Publication types

MeSH terms