

Meta-Analysis
doi: 10.1038/ng.2293.
Common variation near CDKN1A, POLD3 and SHROOM2 influences colorectal cancer risk
Collaborators,
Affiliations
- PMID: 22634755
- PMCID: PMC4747430
- DOI: 10.1038/ng.2293
Item in Clipboard
Meta-Analysis
Common variation near CDKN1A, POLD3 and SHROOM2 influences colorectal cancer risk
Nat Genet.
.
Abstract
We performed a meta-analysis of five genome-wide association studies to identify common variants influencing colorectal cancer (CRC) risk comprising 8,682 cases and 9,649 controls. Replication analysis was performed in case-control sets totaling 21,096 cases and 19,555 controls. We identified three new CRC risk loci at 6p21 (rs1321311, near CDKN1A; P = 1.14 × 10(-10)), 11q13.4 (rs3824999, intronic to POLD3; P = 3.65 × 10(-10)) and Xp22.2 (rs5934683, near SHROOM2; P = 7.30 × 10(-10)) This brings the number of independent loci associated with CRC risk to 20 and provides further insight into the genetic architecture of inherited susceptibility to CRC.
Figures
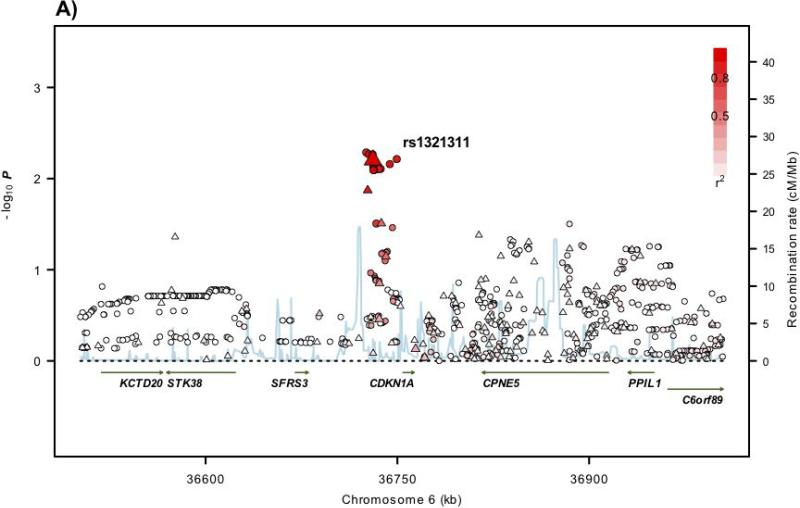
(a-d) Association results of both genotyped (triangles) and imputed (circles) SNPs in the GWAS samples and recombination rates within the loci: (a) 6p21, (b), 11q13.4, (c) Xp22.2. For each plot, −log10
P values (y axis) of the SNPs are shown according to their chromosomal positions (x axis). The top genotyped SNP in each combined analysis is a large triangle and is labelled by its rsID. The colour intensity of each symbol reflects the extent of LD with the top genotyped SNP: white (r2=0) through to dark red (r2=1.0). Genetic recombination rates (cM/Mb), estimated using HapMap CEU samples, are shown with a light blue line. Physical positions are based on NCBI build 36 of the human genome. Also shown are the relative positions of genes and transcripts mapping to each region of association. Genes have been redrawn to show the relative positions; therefore, maps are not to physical scale.
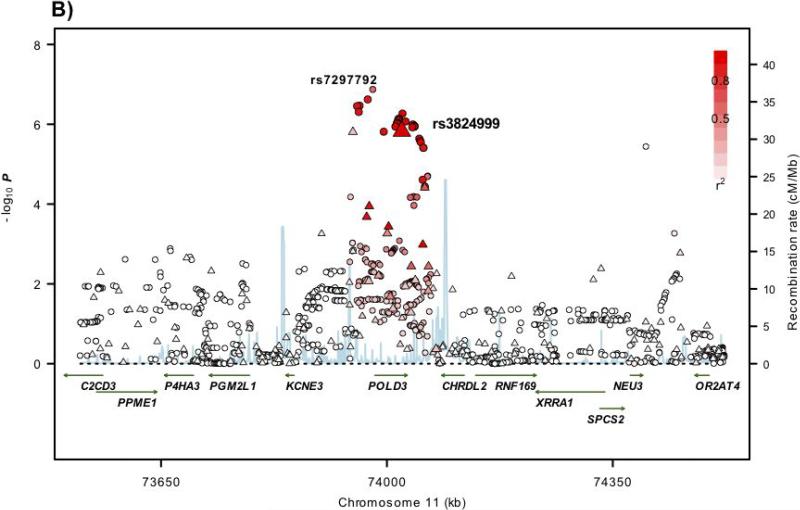
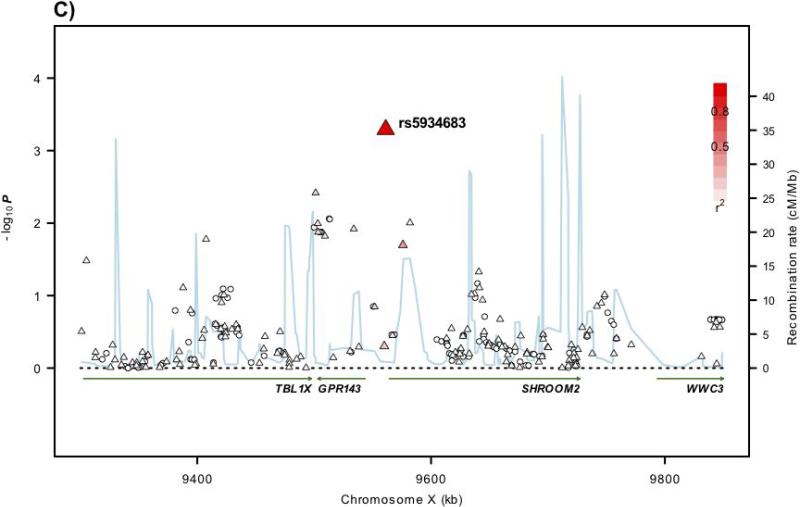
Comment in
-
Meta-analysis of several GWAS sets yields additional genetic susceptibility variants for colorectal cancer: first X-linked component identified.Gastroenterology. 2012 Dec;143(6):1684-5. doi: 10.1053/j.gastro.2012.10.008. Epub 2012 Oct 13. Gastroenterology. 2012. PMID: 23073136 No abstract available.
References
-
- Lichtenstein P, et al. Environmental and heritable factors in the causation of cancer--analyses of cohorts of twins from Sweden, Denmark, and Finland. N Engl J Med. 2000;343:78–85. - PubMed
-
- Aaltonen L, Johns L, Jarvinen H, Mecklin JP, Houlston R. Explaining the familial colorectal cancer risk associated with mismatch repair (MMR)-deficient and MMR-stable tumors. Clin Cancer Res. 2007;13:356–61. - PubMed
-
- Lubbe SJ, Webb EL, Chandler IP, Houlston RS. Implications of familial colorectal cancer risk profiles and microsatellite instability status. J Clin Oncol. 2009;27:2238–44. - PubMed
-
- Tomlinson IP, et al. A genome-wide association study identifies colorectal cancer susceptibility loci on chromosomes 10p14 and 8q23.3. Nat Genet. 2008;40:623–30. - PubMed
Publication types
MeSH terms
Substances
Grants and funding
- 05-0001/AICR_/Worldwide Cancer Research/United Kingdom
- U01 CA074799/CA/NCI NIH HHS/United States
- 12076/CRUK_/Cancer Research UK/United Kingdom
- BB_/Biotechnology and Biological Sciences Research Council/United Kingdom
- MC_U122861325/MRC_/Medical Research Council/United Kingdom
- C10195/A12996/CRUK_/Cancer Research UK/United Kingdom
- U01 CA097735/CA/NCI NIH HHS/United States
- CA-95-011/CA/NCI NIH HHS/United States
- U01 CA074783/CA/NCI NIH HHS/United States
- 10589/CRUK_/Cancer Research UK/United Kingdom
- C1298/A8362/CRUK_/Cancer Research UK/United Kingdom
- 10124/CRUK_/Cancer Research UK/United Kingdom
- MC_U127527198/MRC_/Medical Research Council/United Kingdom
- U01CA122839/CA/NCI NIH HHS/United States
- C490/A10124/CRUK_/Cancer Research UK/United Kingdom
- U01 CA074794/CA/NCI NIH HHS/United States
- C31250/A10107/CRUK_/Cancer Research UK/United Kingdom
- 090532/WT_/Wellcome Trust/United Kingdom
- 090532/Z/09/Z/WT_/Wellcome Trust/United Kingdom
- C10314/A4886/CRUK_/Cancer Research UK/United Kingdom
- C348/A12076/CRUK_/Cancer Research UK/United Kingdom
- G1002033/MRC_/Medical Research Council/United Kingdom
- U01 CA122839/CA/NCI NIH HHS/United States
- 076113/C/04/Z/WT_/Wellcome Trust/United Kingdom
LinkOut - more resources
Full Text Sources
Other Literature Sources
Medical
Molecular Biology Databases
