. 2012 Aug;40(8):2407-16.
doi: 10.1097/CCM.0b013e318253563c.

Ketamine alters the neurogenesis of rat cortical neural stem progenitor cells

Affiliations

Ketamine alters the neurogenesis of rat cortical neural stem progenitor cells

Chaoxuan Dong et al. Crit Care Med. 2012 Aug.

Abstract

Objective: High doses or prolonged exposure to ketamine increase neuronal apoptosis in the developing brain, although effects on neural stem progenitor cells remain unexplored. This study investigated dose- and time-dependent responses to ketamine on cell death and neurogenesis in cultured rat fetal cortical neural stem progenitor cells.

Design: Laboratory-based study.

Setting: University research laboratory.

Subject: Sprague-Dawley rats.

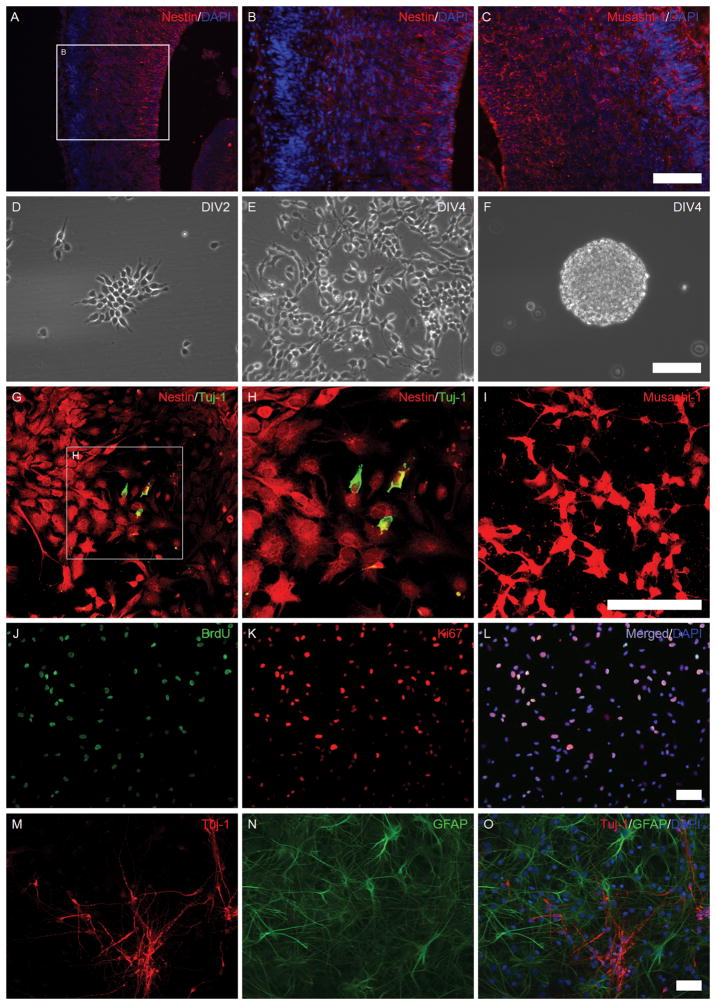
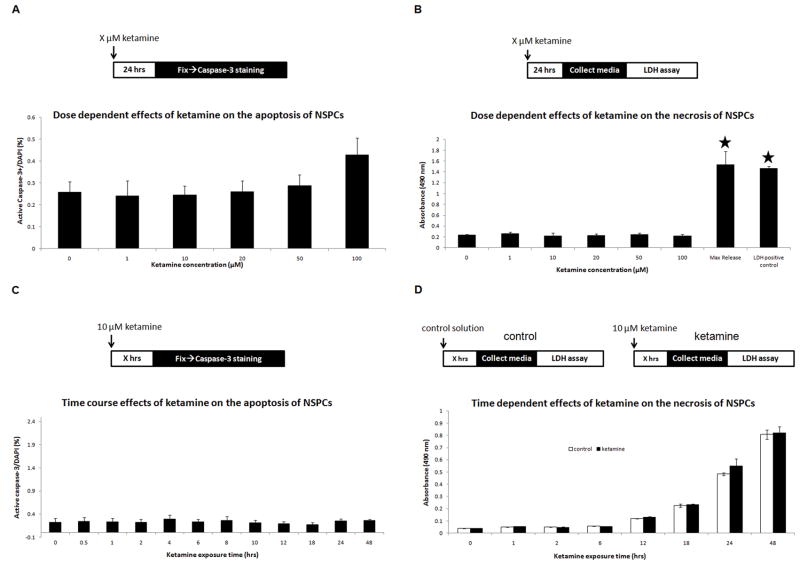
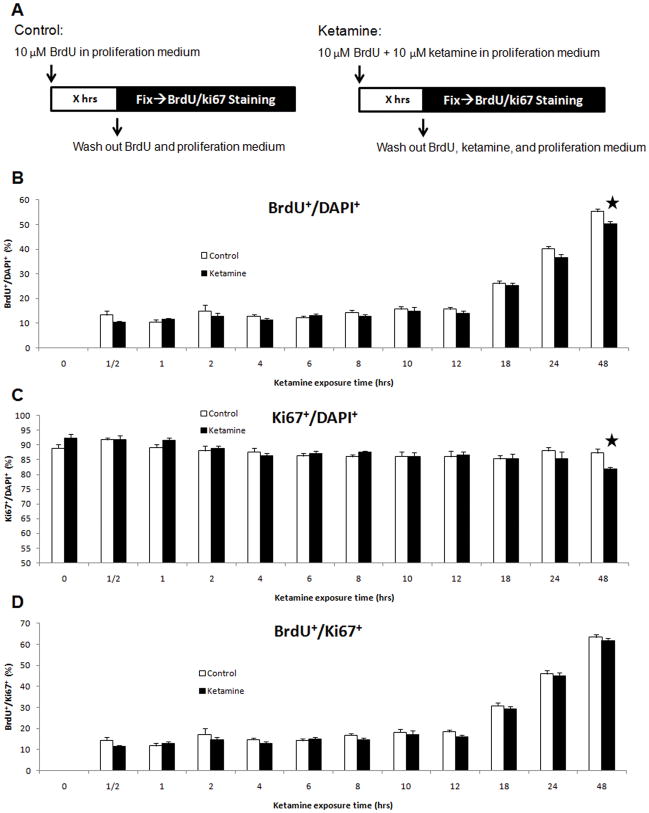
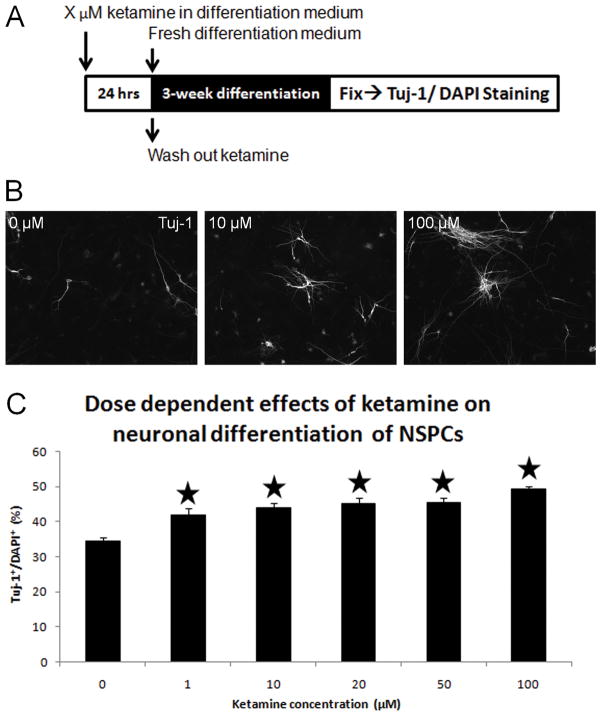
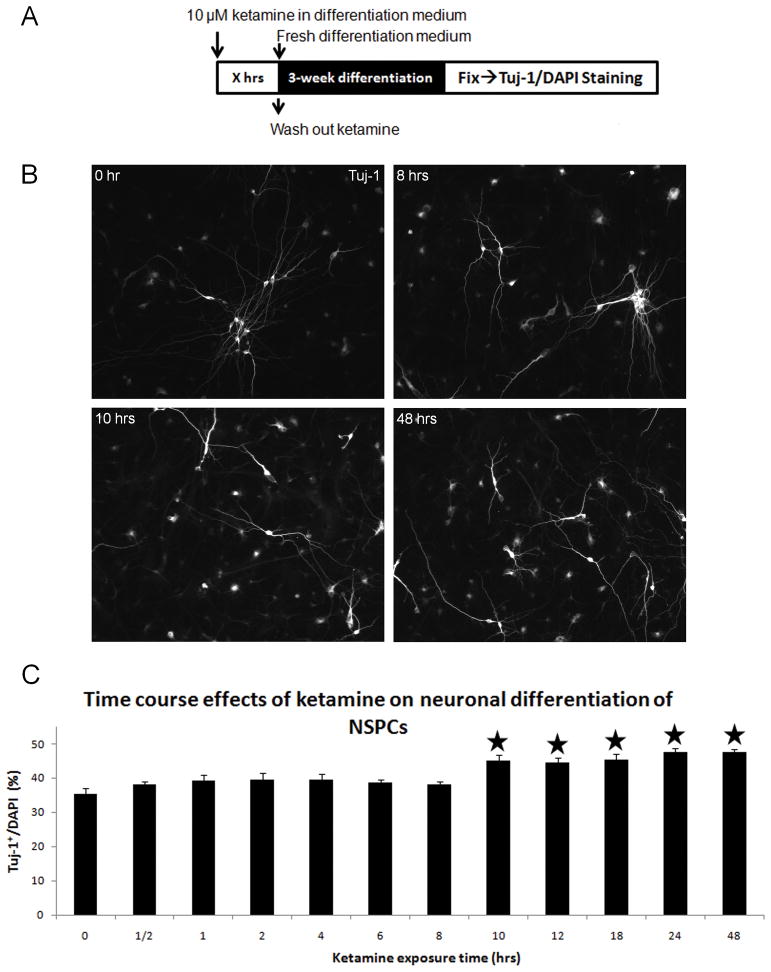
Interventions: Neural stem progenitor cells were isolated from the cortex of Sprague-Dawley rat fetuses on embryonic day 17. In dose-response experiments, cultured neural stem progenitor cells were exposed to different concentrations of ketamine (0-100 µM) for 24 hrs. In time-course experiments, neural stem progenitor cells cultures were exposed to 10 µM ketamine for different durations (0-48 hrs).

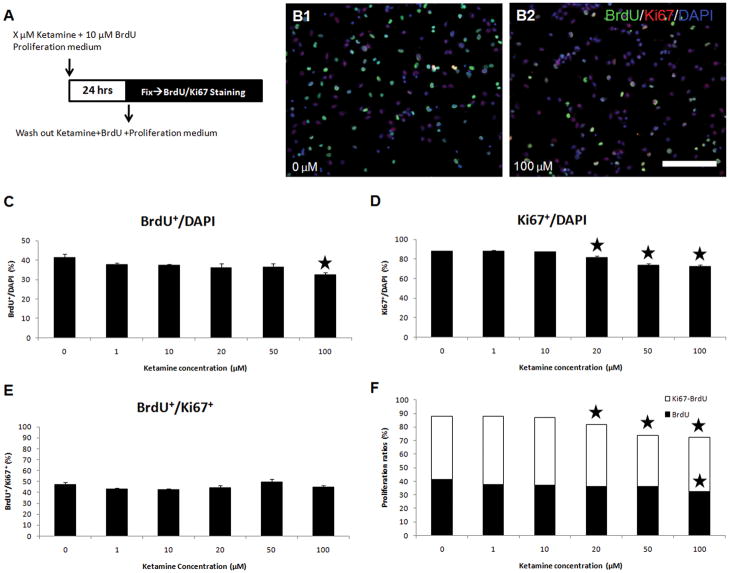
Measurements and main results: Apoptosis and necrosis in neural stem progenitor cells were assessed using activated caspase-3 immunostaining and lactate dehydrogenase assays, respectively. Proliferative changes in neural stem progenitor cells were detected using bromo-deoxyuridine incorporation and Ki67 immunostaining. Neuronal differentiation was assessed using Tuj-1 immunostaining. Cultured neural stem progenitor cells were resistant to apoptosis and necrosis following all concentrations and durations of ketamine exposure tested. Ketamine inhibited proliferation with decreased numbers of bromo-deoxyuridine-positive cells following ketamine exposure to 100 µM for 24 hrs (p<.005) or 10 µM for 48 hrs (p< .01), and reduced numbers of Ki67-positive cells following exposure to ketamine concentration>10 µM for 24 hrs (p<.001) or at 10 µM for 48 hrs (p<.01). Ketamine enhanced neuronal differentiation, with all ketamine concentrations increasing Tuj-1-positive neurons (p<.001) after 24-hrs of exposure. This also occurred with all exposures to 10 µM ketamine for >8 hrs (p<.001).

Conclusions: Clinically relevant concentrations of ketamine do not induce cell death in neural stem progenitor cells via apoptosis or necrosis. Ketamine alters the proliferation and increases the neuronal differentiation of neural stem progenitor cells isolated from the rat neocortex. These studies imply that ketamine exposure during fetal or neonatal life may alter neurogenesis and subsequent brain development.


Conflict of interest statement

The authors have not disclosed any potential conflicts of interest

Figures

Figure 1
Figure 1. The isolation and identification of NSPCs from the fetal brain
Images A–C: rat fetal brain sections were immunostained using anti-Nestin (red), anti-Musashi-1 (red), and DAPI (blue). Images D–F: in vitro cultured NSPCs; Images D–E: adherent monolayer NSPC cultures at days 2–4 in vitro; Image F: NSPC neurospheres in a non-coated culture dish. Images G–I: the expression of Nestin, Tuj-1, and Musashi-1 in cultured NSPCs (confocal microscopy); Images G–H: Nestin (red) and Tuj-1 (green); Image I: Musashi-1 (red). Images J–L: The proliferative potency of NSPCs; Image J: BrdU (green); Image K: Ki67 (red); Image L: a merged picture of image J, K, and DAPI (blue). Images M–O: Differentiation potency of NSPCs; Image M: Tuj-1 (red), a marker for newborn neurons; Image N: GFAP (green), a marker for astrocytes; Image O: a merged picture of Images M, N, and DAPI (blue). (Scale bars: 50 μm).
Figure 2
Figure 2. The expression of NMDA receptors in cultured NSPCs from rat fetal cortex
Images A–C: the expression of NR1 in the rat fetal brain, NR1 (green) and DAPI (blue). Image A: cortical plate (400X magnification); Image B: entire neocortex (100X magnification); Image C: VZ and SVZ regions (400X magnification). Images D and E: the expression of NR1 (green) in cultured NSPCs; Image E is a magnified picture of the inset of Image D. Images F and G: the expression of NR2A and NR2B in cultured NSPCs. Image F: NR2A (green) and DAPI (blue); Image G: NR2B (green) and DAPI (blue). (Scale bars: 50 μm)
Figure 3
Figure 3. Effects of ketamine on apoptosis and necrosis in cultured NSPCs
Panel A: dose-dependent responses of ketamine on apoptosis in cultured NSPCs. Ketamine exposure concentrations: X = 0, 1, 10, 20, 50, and 100 μM. Panel B: dose-dependent responses of ketamine (X = 0, 1, 10, 20, 50, or 100 μM) on necrosis in cultured NSPCs. Maximal release, cells were treated by Triton X-100; LDHpositive control, provided by the LDH assay kit. Absorbance values were measured at 490 nm. Stars represent significant differences compared to the control and all ketamine treatment groups. Panel C: time-dependent effects of ketamine on apoptosis of cultured NSPCs, as measured by percentage of active caspase-3+ cells in DAPI+ cells. Ketamine exposure duration: X = 0, 0.5, 1, 2, 4, 6, 8, 10, 12, 18, 24, and 48 hours. Panel D: time-dependent effects of ketamine on necrosis of cultured NSPCs using LDH assays. NSPC cultures were exposed to 10 μM of ketamine (black columns) for different durations (X = 0, 1, 2, 6, 12, 18, 24, and 48 hours) with parallel controls (white columns). No significant difference was found.
Figure 4
Figure 4. Dose-dependent effects of ketamine on the proliferation of NPSCs
Panel A: Ketamine (concentrations: X = 0, 1, 10, 20, 50, or 100 μM) and BrdU were added to culture media for 24 hours, then cells were fixed and stained with anti-BrdU and anti-Ki67 antibodies. Panel B: two typical pictures showing the difference of BrdU and Ki67 staining between the control (B1) and 100 μM ketamine (B2) groups. In the images, green or white points are BrdU+ cells; purple points are Ki67+ and BrdU. (Scale bar: 50 μm) Panels C–F: dose-dependent effects of ketamine on the proliferation of NSPCs. Panel C: the percentage of BrdU+ cells in total cells (DAPI+) is plotted versus different concentrations of ketamine. Panel D: the percentage of Ki67+ cells in the total cells (DAPI+) exposed to ketamine. Panel E: the percentage of BrdU+ cells in Ki67+ cells represents the percentage of proliferating cells to the cells having proliferative capacity. Panel F: a combined graph of graphs C and D. (stars represent significant differences ketamine vs. control).
Figure 5
Figure 5. Time-dependent effects of ketamine on the proliferation of NSPCs
Panel A: 10 μM of ketamine was added into cultures for different durations (X = 0,½, 1, 2, 4, 6, 8, 10, 12, 18, 24, and 48 hours) with parallel controls at each time point. Cultures were fixed and stained with anti-BrdU, anti-Ki67 antibodies and DAPI. Panels B–D: time-course response of ketamine on proliferation of cultured NSPCs. Panel B: the percentage of BrdU+ cells in total cells (DAPI+) vs. ketamine exposure time. Panel C: percentage of Ki67+ cells in the total cells (DAPI+) vs. ketamine exposure time. Panel D: the ratio of BrdU+ cells to Ki67+ cells vs. ketamine exposure time. (Stars represent the significant differences ketamine vs. control)
Figure 6
Figure 6. Dose-dependent effects of ketamine on neuronal differentiation of NPSCs
Panel A: dose-dependent effects of ketamine on neuronal differentiation of NSPCs exposed to ketamine (concentration: X = 0, 1, 10, 20, 50, and 100 μM) over a 3-week spontaneous differentiation phase. Panel B: Tuj-1 staining of differentiated NSPCs exposed to 0, 10, and 100 μM of ketamine for 24 hours. Panel C: changes in the percentage of the Tuj-1+ cells in total cells (DAPI+) vs. ketamine concentrations. (Stars represent the significant differences ketamine vs. control)
Figure 7
Figure 7. Time-dependent effects of ketamine on neuronal differentiation of NSPCs
Panel A: NSPC cultures were exposed to 10 μM of ketamine for different durations (X = 0, ½, 1, 2, 4, 6, 8, 10, 12, 18, 24, and 48 hours). Panel B: Tuj-1 staining of differentiated NSPCs exposed to 10 μM of ketamine for 0, 8, 10, and 48 hours. Panel C: time-dependent effects of ketamine on neuronal differentiation of NSPCs. (Stars represent the significant differences ketamine vs. control)

Comment in

Similar articles

Cited by

References

    1. Sinner B, Graf BM. Ketamine. Handb Exp Pharmacol. 2008;182:313–333. - PubMed
    1. Rappaport B, Mellon RD, Simone A, et al. Defining safe use of anesthesia in children. N Engl J Med. 2011;364(15):1387–1390. - PubMed
    1. Ikonomidou C, Bosch F, Miksa M, et al. Blockade of NMDA receptors and apoptotic neurodegeneration in the developing brain. Science. 1999;283(5398):70–74. - PubMed
    1. Scallet AC, Schmued LC, Slikker W, Jr, et al. Developmental neurotoxicity of ketamine: morphometric confirmation, exposure parameters, and multiple fluorescent labeling of apoptotic neurons. Toxicol Sci. 2004;81(2):364–370. - PubMed
    1. Slikker W, Jr, Zou X, Hotchkiss CE, et al. Ketamine-induced neuronal cell death in the perinatal rhesus monkey. Toxicol Sci. 2007;98(1):145–158. - PubMed

Publication types

MeSH terms