. 2012 Aug;67(8):1948-60.
doi: 10.1093/jac/dks161. Epub 2012 May 25.

A new in vivo model to test anti-tuberculosis drugs using fluorescence imaging

Affiliations

A new in vivo model to test anti-tuberculosis drugs using fluorescence imaging

Andrea Zelmer et al. J Antimicrob Chemother. 2012 Aug.

Abstract

Objectives: The current method for testing new drugs against tuberculosis in vivo is the enumeration of bacteria in organs by cfu assay. Owing to the slow growth rate of Mycobacterium tuberculosis (Mtb), these assays can take months to complete. Our aim was to develop a more efficient, fluorescence-based imaging assay to test new antibiotics in a mouse model using Mtb reporter strains.

Methods: A commercial IVIS Kinetic® system and a custom-built laser scanning system with fluorescence molecular tomography (FMT) capability were used to detect fluorescent Mtb in living mice and lungs ex vivo. The resulting images were analysed and the fluorescence was correlated with data from cfu assays.

Results: We have shown that fluorescent Mtb can be visualized in the lungs of living mice at a detection limit of ∼8 × 10⁷ cfu/lung, whilst in lungs ex vivo a detection limit of ∼2 × 10⁵ cfu/lung was found. These numbers were comparable between the two imaging systems. Ex vivo lung fluorescence correlated to numbers of bacteria in tissue, and the effect of treatment of mice with the antibiotic moxifloxacin could be visualized and quantified after only 9 days through fluorescence measurements, and was confirmed by cfu assays.

Conclusions: We have developed a new and efficient method for anti-tuberculosis drug testing in vivo, based on fluorescent Mtb reporter strains. Using this method instead of, or together with, cfu assays will reduce the time required to assess the preclinical efficacy of new drugs in animal models and enhance the progress of these candidates into clinical trials against human tuberculosis.


Figures
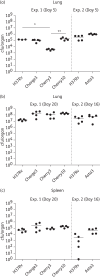
Figure 1.
Figure 1.
Fitness testing of fluorescent reporter strains of Mtb. In two separate experiments (Exp. 1 and Exp. 2) CB-17 SCID mice (n = 5) were infected with fluorescent or WT strains of Mtb via the intranasal route. (a) cfu in lung tissue at the early timepoint (5 days after infection). (b) cfu in lung tissue at later timepoints (16 and 20 days after infection). (c) cfu in spleen tissue at later timepoints (16 and 20 days after infection). Each data point represents an individual organ, and horizontal lines represent the means. Input inocula/mouse: Exp. 1: H37Rv, 2.9 × 103 cfu; Charge3, 1.2 × 103 cfu; Cherry3, 2 × 103 cfu; Cherry10, 2.3 × 103 cfu; Exp. 2: H37Rv, 1 × 104 cfu; Asta3, 4 × 103 cfu. **P < 0.01; *P < 0.05.
Figure 2.
Figure 2.
In vivo imaging of Mtb reporter strains. CB-17 SCID mice infected in Figure 1 with Mtb Charge3, Cherry3, Cherry10, Asta3 or the parental Mtb H37Rv WT strain were imaged using the IVIS system at 16 days (d) or 20 days (a–c) post-infection. Images were taken using the following settings: (a–c) excitation filter 605 nm, emission filter 660 nm, f-stop 2, exposure time 3 s; (d) excitation filter 570 nm, emission filter 620 nm, f-stop 2, exposure time 5 s. Non-specific fluorescence was recorded using a lower excitation wavelength [(a–c) 500 nm; (d) 465 nm]. Fluorescence intensity is presented as efficiency and depicted as false colour, where dark red corresponds to the lowest intensity and yellow to the highest intensity.
Figure 3.
Figure 3.
Time course of infection of CB-17 SCID mice with Mtb Charge3. Groups of CB-17 SCID mice (n = 5/group) were infected via the intranasal route with Mtb Charge3 or the parental Mtb H37Rv WT strain. (a) The same representative group of five animals (indicated by M1–M5) is shown in each image. Images were acquired at the indicated timepoints with an exposure time of 10 s. Fluorescence intensity is presented as efficiency and depicted as false colour, where dark red corresponds to the lowest intensity and yellow to the highest intensity. (b) and (c) Bacterial burden of Mtb Charge3 as cfu in lung and spleen, respectively, over the course of the infection. Each data point represents an individual organ, and horizontal lines represent the means. (d) Quantification of fluorescence intensity over the thoracic area only as determined by ROI analysis. All animals were included in this analysis up to the timepoint when they were killed for cfu analysis or because they had reached their humane endpoint (Charge3 infected: n = 25 for days 4 and 7; n = 20 for day 12; n = 15 for day 15; H37Rv infected: n = 5 for all timepoints). Data are presented as means ± SEM (Charge3, filled circles; H37Rv, open squares). Due to logistical constraints within the containment suite, images were acquired on day 12 after infection, whilst bacterial burden was determined the following day (day 13). Input inocula/mouse: Charge3, 1.7 × 104 cfu; H37Rv, 2 × 103 cfu. **P < 0.01. ND, not determined.
Figure 4.
Figure 4.
Ex vivo fluorescence imaging of lungs harvested from Mtb Charge3-infected mice. (a) Groups of CB-17 SCID mice (n = 5) were infected intranasally with Mtb Charge3 or H37Rv WT, then animals were killed and lungs aseptically removed at 7, 13 or 15 days after infection as indicated. (b) Fluorescence (red line) was quantified by drawing an ROI over the thoracic area using Living Image software. Fluorescence is shown as efficiency. cfu data (black broken line) are the same data shown in Figure 3, but are included here for comparison. Data are presented as means ± SEM of five individual mice. (c) Correlation of cfu and fluorescence intensity of lungs shown in (a). Each data point represents an individual organ. The number of cfu X for a given fluorescence measurement Y is described by the equation shown, which was obtained from linear regression analysis. Input inocula/mouse: Charge3, 1.7 × 104 cfu; H37Rv, 2 × 103 cfu. r is the Pearson correlation coefficient. **P < 0.01.
Figure 5.
Figure 5.
Ex vivo imaging of lungs from mice infected with Mtb Charge3 or H37Rv, comparing IVIS and LS systems. (a) CB-17 SCID mice were infected with Mtb Charge3 (n = 13) or Mtb H37Rv (n = 3) as an imaging negative control. Mice were killed at 12, 15 or 18 days after infection, and lungs were removed and imaged in the IVIS and LS systems (emission filter 620/40 nm for LS). Representative images were chosen from days 12 and 15. Images from day 12 were chosen as examples of low fluorescence and images from day 15 provide examples of high fluorescence. IVIS images are shown in the top row, with LS images of the same lungs shown underneath. (b) Enlarged copy of images taken from day 15. Fluorescence is presented as efficiency or normalized fluorescence for the IVIS system and LS system, respectively. Input inocula/mouse: Charge3, 4.8 × 104 cfu; H37Rv, 2.3 × 104 cfu.
Figure 6.
Figure 6.
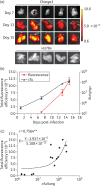
Ex vivo imaging of lungs from SHO mice infected with Mtb Charge3 and treated with moxifloxacin or saline. (a) Groups of SHO mice (n = 5) were infected intranasally with Mtb Charge3 or H37Rv and given seven daily doses of either saline or moxifloxacin by oral gavage on days 1–7 after infection, and lungs were aseptically removed at 1, 9, 19 or 28 days after infection. Lungs were then imaged in the IVIS and LS systems. Images acquired with the IVIS system are shown on the left and images of the same lungs acquired with the LS system are shown on the right. Fluorescence is presented as efficiency or normalized fluorescence for the IVIS system and LS system, respectively. Note that different scales were used for the LS images on days 1 and 9 and days 19 and 28. (b) and (c) Fluorescence was quantified over time by ROI analysis using Living Image or Matlab software. Data are presented as means ± SEM of individual lungs shown in (a) (saline, filled squares; moxifloxacin, open squares). Input inocula/mouse: Charge3, H37Rv, 3.1 × 103 cfu. **P < 0.01; *P < 0.05; ns (not significant) P > 0.05.
Figure 7.
Figure 7.
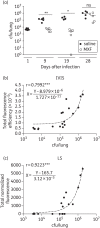
Bacterial burden of lungs from SHO mice infected with Mtb Charge3 and treated with moxifloxacin or saline. (a) Lungs of mice from Figure 6 were assayed for bacterial burden at different timepoints after treatment with saline (filled circles) or moxifloxacin (open circles) as indicated. Each data point represents an individual organ and horizontal lines represent the means. (b) and (c) Correlation of cfu in lungs of saline-treated mice to fluorescence measurements of lungs ex vivo using the IVIS or LS system. Each data point represents an individual organ. The number of cfu X for a given fluorescence measurement Y is described by the equations shown, which were obtained from linear regression analysis. r is the Pearson correlation coefficient. ***P < 0.001; **P < 0.01; *P < 0.05; ns (not significant) P > 0.05.

References

    1. WHO. Tuberculosis. http://www.who.int/mediacentre/factsheets/fs104/en/index.html. (23 September 2011, date last accessed)
    1. Rowland R, McShane H. Tuberculosis vaccines in clinical trials. Expert Rev Vaccines. 2011;10:645–58. doi:10.1586/erv.11.28. - DOI - PMC - PubMed
    1. Colditz GA, Brewer TF, Berkey CS, et al. Efficacy of BCG vaccine in the prevention of tuberculosis. Meta-analysis of the published literature. JAMA. 1994;271:698–702. doi:10.1001/jama.1994.03510330076038. - DOI - PubMed
    1. WHO. Map: Available Data on Anti-TB Drug Resistance, 2010. http://www.who.int/tb/challenges/mdr/drs_maps_feb2011.pdf. (23 September 2011, date last accessed)
    1. Dorhoi A, Reece ST, Kaufmann SH. For better or for worse: the immune response against Mycobacterium tuberculosis balances pathology and protection. Immunol Rev. 2011;240:235–51. doi:10.1111/j.1600-065X.2010.00994.x. - DOI - PubMed

Publication types

MeSH terms