. 2012 Oct;22(10):1995-2007.
doi: 10.1101/gr.137570.112. Epub 2012 May 25.

Integrative analysis of genome-wide loss of heterozygosity and monoallelic expression at nucleotide resolution reveals disrupted pathways in triple-negative breast cancer

Affiliations

Integrative analysis of genome-wide loss of heterozygosity and monoallelic expression at nucleotide resolution reveals disrupted pathways in triple-negative breast cancer

Gavin Ha et al. Genome Res. 2012 Oct.

Abstract

Loss of heterozygosity (LOH) and copy number alteration (CNA) feature prominently in the somatic genomic landscape of tumors. As such, karyotypic aberrations in cancer genomes have been studied extensively to discover novel oncogenes and tumor-suppressor genes. Advances in sequencing technology have enabled the cost-effective detection of tumor genome and transcriptome mutation events at single-base-pair resolution; however, computational methods for predicting segmental regions of LOH in this context are not yet fully explored. Consequently, whole transcriptome, nucleotide-level resolution analysis of monoallelic expression patterns associated with LOH has not yet been undertaken in cancer. We developed a novel approach for inference of LOH from paired tumor/normal sequence data and applied it to a cohort of 23 triple-negative breast cancer (TNBC) genomes. Following extensive benchmarking experiments, we describe the nucleotide-resolution landscape of LOH in TNBC and assess the consequent effect of LOH on the transcriptomes of these tumors using RNA-seq-derived measurements of allele-specific expression. We show that the majority of monoallelic expression in the transcriptomes of triple-negative breast cancer can be explained by genomic regions of LOH and establish an upper bound for monoallelic expression that may be explained by other tumor-specific modifications such as epigenetics or mutations. Monoallelically expressed genes associated with LOH reveal that cell cycle, homologous recombination and actin-cytoskeletal functions are putatively disrupted by LOH in TNBC. Finally, we show how inference of LOH can be used to interpret allele frequencies of somatic mutations and postulate on temporal ordering of mutations in the evolutionary history of these tumors.


Figures

Figure 1.
Figure 1.
Illustration of empirical allelic ratios between tumor and normal genomic sequencing data from chromosome 20 of a triple-negative breast cancer genome (SA225), and effects of copy number. (A) Allelic ratio data of heterozygous loci in the normal genome are centered around 0.5, which represents the presence of two alleles. (B) At the same corresponding loci, allelic ratios in the tumor genome reveal four examples of somatically acquired segments of allelic imbalance in regions (i)–(iv). (C) The segmental copy number of the tumor helps give context to the allelic data: (i) copy neutral LOH (NLOH), AA/BB; (ii) deletion-induced LOH (DLOH), A/B; (iii) amplified LOH (ALOH), AAA/BBB; and (iv) allele-specific amplification (ASCNA), AAAB/ABBB. Allelic ratio value is defined as the reference read counts divided by total depth at a given position. A and B represent reference and nonreference alleles in the genotype, respectively.
Figure 2.
Figure 2.
Systematic comparison of loss-of-heterozygosity (LOH) predictions for chromosome 20 of a triple-negative breast cancer genome (SA225). The OncoSNP software (Yau et al. 2010) was applied on an orthogonal platform, Affymetrix SNP6 arrays, and served as the ground truth data set for evaluation. SNVMix (Goya et al. 2010) was used to predict homozygous (LOH) and heterozygous (HET) genotypes on the whole-genome shotgun (WGSS) data to represent the independent, identically distributed (iid) model. APOLLOH is the full model that models copy number (CN) and normal contamination (SP). APOLLOH-noCN is a model variant of APOLLOH that analyzes WGSS without copy number or estimating normal contamination parameter, but models spatial correlation (SC) to predict only LOH and HET in a reduced state space. APOLLOH-noS models copy number but not normal cell proportion, predicting additional marginal states of allele-specific copy number amplification (ASCNA) in an expanded state space. Copy number results were predicted by HMMcopy (Supplemental Methods). Copy number states are amplification (AMP, four to five copies), neutral (NEUT, two copies), hemizygous deletion (HEMD, one copy), and homozygous deletion (HOMD).
Figure 3.
Figure 3.
Comparison and evaluation of APOLLOH results using data from Affymetrix SNP6.0 genotyping arrays as the benchmark. (A) Initial benchmarking by comparing WGSS-derived allelic ratios and SNP6 B-allele frequencies. Three samples are shown with LOH clusters centered at locations reflecting APOLLOH normal contamination estimation. (B) For the 23 TNBC samples, precision, recall, and F-measure metrics were computed for LOH predictions from each APOLLOH model variant and SNVMix using OncoSNP (Yau et al. 2010) predictions (from SNP6 data) as the ground truth.
Figure 4.
Figure 4.
Tumor-normal sampling admixture experiment. Nine mixture proportions generated by sampling reads from the tumor and normal BAM files were analyzed (see Methods). (A) APOLLOH results are shown for chromosome 9 of mixture proportions of 0.09, 0.26, 0.43, 0.60, and 0.77 tumor reads sampled to 30×. (Tumour100) Results from the original tumor sample. (B) The normal proportion parameter s inferred by APOLLOH was significantly correlated (Spearman's rho = 0.92) with the mixture proportions of 0.1–1.0 (increments of 0.1) at 30× and 60×. (C) The F-Measure performance of APOLLOH and APOLLOH-noS (not accounting for normal contamination) for 30× and 60× admixtures was evaluated using Affymetrix SNP6.0 data as ground truth.
Figure 5.
Figure 5.
Genome-wide gene frequencies of APOLLOH predictions, copy number profiles from the current 23 cases, and an external (METABRIC) data set (Curtis et al. 2012), and monoallelic expression. From top to bottom, the first and second panels show copy number profiles for cohorts of 118 basal-like subtype breast cancer patients from METABRIC, analyzed on Affymetrix SNP6.0 arrays, and the 23 TNBC patients. Deletion gene frequency profiles (negated for display purposes) in both data sets show similar patterns to deletion LOH frequencies shown in the third panel. The fourth and fifth panels, respectively, show the profile of genes affected by copy neutral LOH and the profile of overall LOH events including genes found within deletions, copy neutral regions, and amplifications. The last panel shows the frequency profile of genes that are observed with monoallelic expression (MAE) as a consequence of genomic LOH events for 22 samples with available RNA-seq data.
Figure 6.
Figure 6.
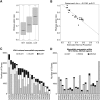
Integrative analysis of APOLLOH results and transcriptome RNA-seq expression. (A) The distribution of transcriptome RNA-seq symmetric allelic ratios that fall within HET, ASCNA, and LOH predicted regions are significantly different (pairwise Wilcoxon one-tailed test, p < 0.01). (B) The median symmetric allelic ratio of RNA-seq data within predicted LOH segments for each sample, represented as a point, strongly negatively correlated (Spearman's rho = −0.91) with estimated normal proportion parameter s (first principal component line is shown). (C,D) Distribution of the number of monoallelic expressed genes within genomic loss-of-heterozygosity (LOH), heterozygous (HET), and allele-specific copy number amplification (ASCNA) regions in 23 breast cancer samples. (C) The number of MAE genes established by LOH events are categorized into deletion (DLOH), copy neutral (NLOH), and amplification (ALOH) and sorted by total LOH in descending order. (D) The number of genes with MAE that overlapped genomic HET, balanced CNA (BCNA), and ASCNA regions are shown in same sorted order as in C.
Figure 7.
Figure 7.
Pathway enrichment analysis of genes with monoallelic expression (MAE) established by loss-of-heterozygosity (LOH) events. Gene networks were inferred using Reactome Functional Interaction software (Wu et al. 2010) within the Cytoscape (Smoot et al. 2011) plug-in. LOH-induced MAE genes were used in the analysis and subsequently clustered into modules. At a false discovery rate (FDR) of 0.05, significantly enriched pathways included Modules 0–5. Shown are the Enrichment Map (Merico et al. 2010) networks generated for the significant pathways (Supplemental Table S13), highlighting the interactions between pathways identified within each of the six modules.

Similar articles

Cited by

References

    1. Bengtsson H, Neuvial P, Speed TP 2010. Tumorboost: Normalization of allele-specific tumor copy numbers from a single pair of tumor-normal genotyping microarrays. BMC Bioinformatics 11: 245 doi: 10.1186/1471-2105-11-245 - PMC - PubMed
    1. Berger AH, Knudson AG, Pandolfi PP 2011. A continuum model for tumour suppression. Nature 476: 163–169 - PMC - PubMed
    1. Beroukhim R, Lin M, Park Y, Hao K, Zhao X, Garraway LA, Fox EA, Hochberg EP, Mellinghoff IK, Hofer MD, et al. 2006. Inferring loss-of-heterozygosity from unpaired tumors using high-density oligonucleotide SNP arrays. PLoS Comput Biol 2: e41 doi: 10.1371/journal.pcbi.0020041 - PMC - PubMed
    1. Boeva V, Popova T, Bleakley K, Chiche P, Cappo J, Schleiermacher G, Janoueix-Lerosey I, Delattre O, Barillot E 2011. Control-FREEC: A tool for assessing copy number and allelic content using next generation sequencing data. Bioinformatics 28: 423–425 - PMC - PubMed
    1. Bowtell DD 2010. The genesis and evolution of high-grade serous ovarian cancer. Nat Rev Cancer 10: 803–808 - PubMed

Publication types