. 2012 Jul 13;287(29):24216-27.
doi: 10.1074/jbc.M112.353979. Epub 2012 May 27.

Lecithin:retinol acyltransferase is critical for cellular uptake of vitamin A from serum retinol-binding protein

Affiliations

Lecithin:retinol acyltransferase is critical for cellular uptake of vitamin A from serum retinol-binding protein

Jaume Amengual et al. J Biol Chem. .

Abstract

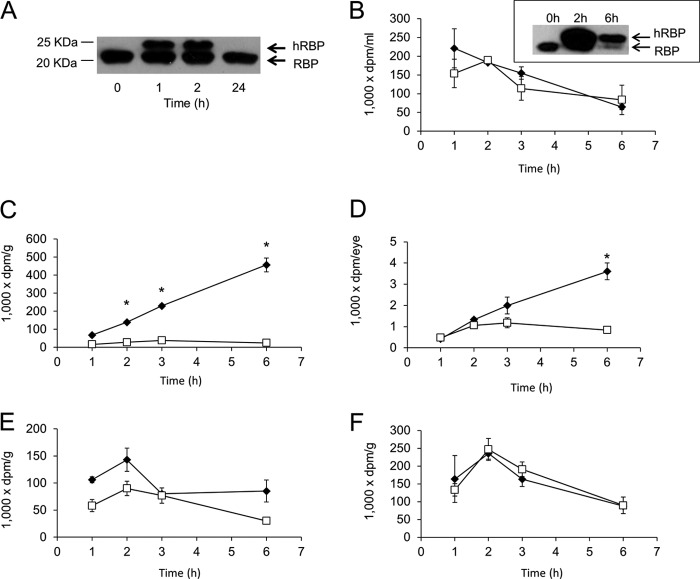
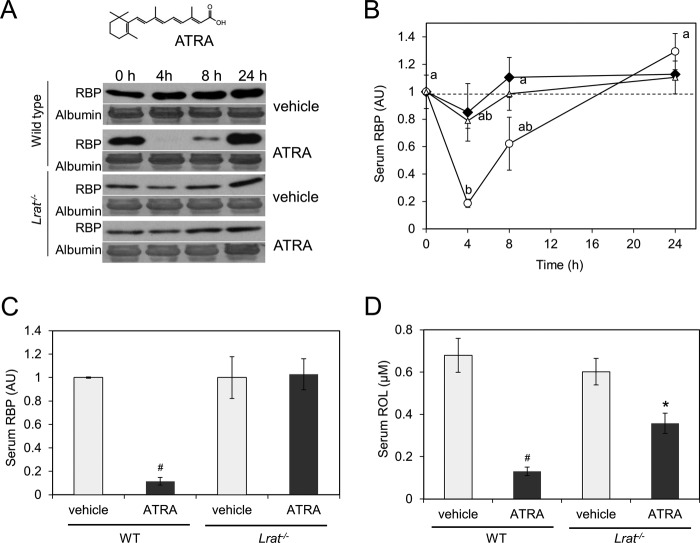
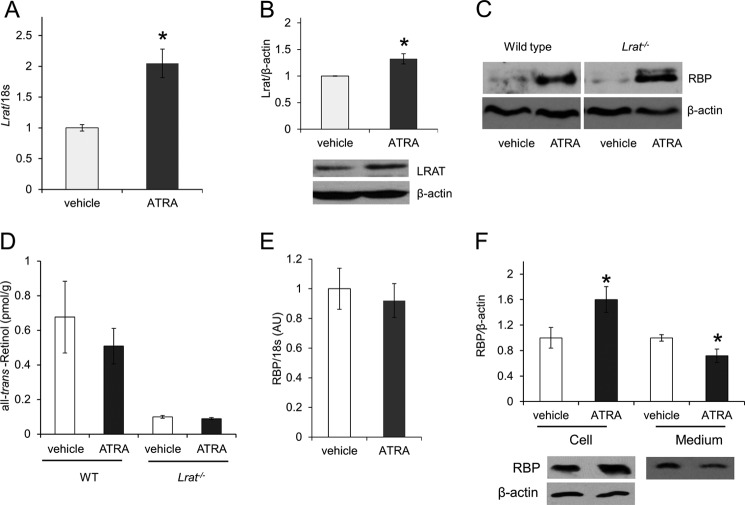
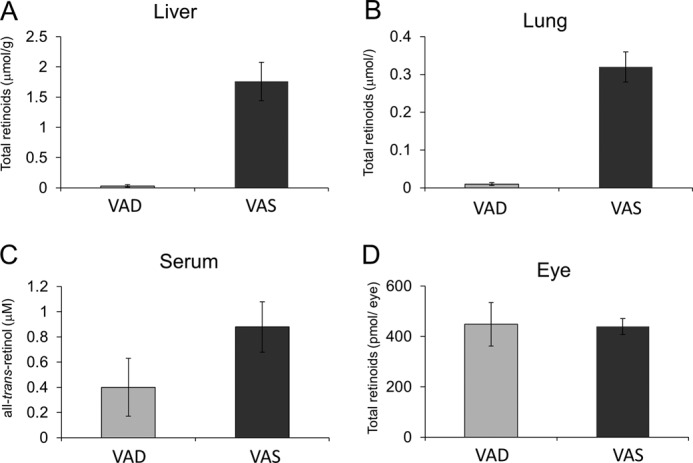
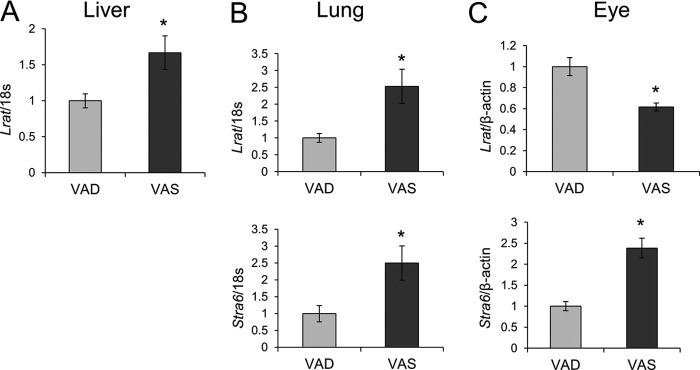
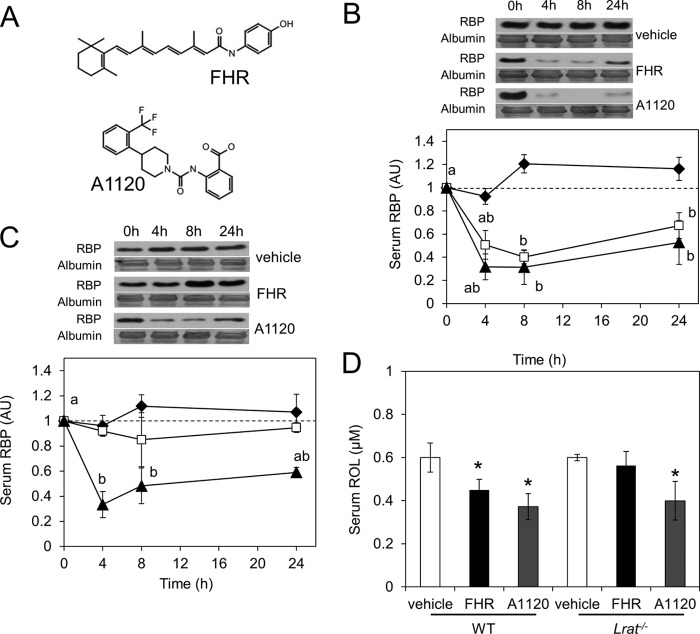
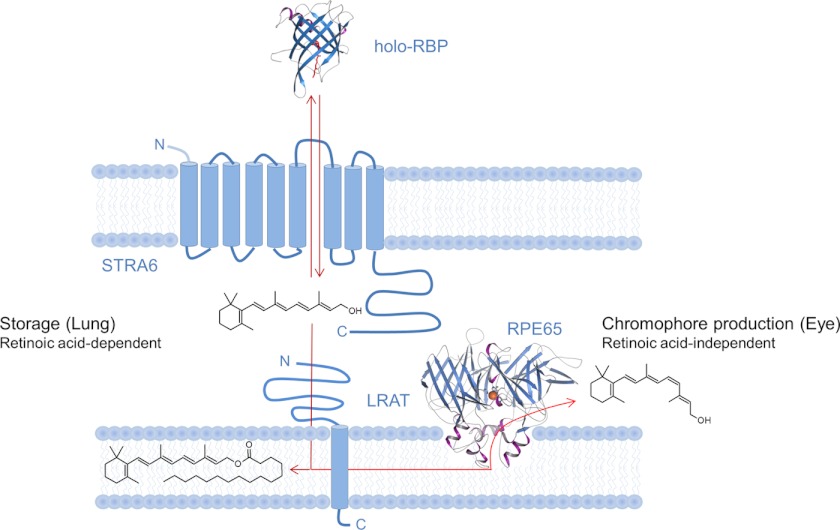
Vitamin A (all-trans-retinol) must be adequately distributed within the mammalian body to produce visual chromophore in the eyes and all-trans-retinoic acid in other tissues. Vitamin A is transported in the blood bound to retinol-binding protein (holo-RBP), and its target cells express an RBP receptor encoded by the Stra6 (stimulated by retinoic acid 6) gene. Here we show in mice that cellular uptake of vitamin A from holo-RBP depends on functional coupling of STRA6 with intracellular lecithin:retinol acyltransferase (LRAT). Thus, vitamin A uptake from recombinant holo-RBP exhibited by wild type mice was impaired in Lrat(-/-) mice. We further provide evidence that vitamin A uptake is regulated by all-trans-retinoic acid in non-ocular tissues of mice. When in excess, vitamin A was rapidly taken up and converted to its inert ester form in peripheral tissues, such as lung, whereas in vitamin A deficiency, ocular retinoid uptake was favored. Finally, we show that the drug fenretinide, used clinically to presumably lower blood RBP levels and thus decrease circulating retinol, targets the functional coupling of STRA6 and LRAT to increase cellular vitamin A uptake in peripheral tissues. These studies provide mechanistic insights into how vitamin A is distributed to peripheral tissues in a regulated manner and identify LRAT as a critical component of this process.


Figures

FIGURE 1.
FIGURE 1.
Cellular uptake of retinol from holo-RBP is LRAT-dependent. A, immunoblot analysis of recombinant hRBP and endogenous RBP protein levels in mouse serum after hRBP intraperitoneal injection. B–F, hRBP was expressed in E. coli, purified, and refolded in the presence of a mixture of non-labeled and tritiated [3H]retinol. Then 100 μl of radiolabeled hRBP (corresponding to 0.4 μCi) was injected intraperitoneally into wild type (filled diamonds) and Lrat−/− (open squares) mice. B, levels of [3H]retinol in the serum of these mice. The inset shows an immunoblot analysis of RBP in their serum. Levels of [3H]retinol in the lungs (C), eyes (D), adipose tissue (E), and kidneys (F) of these mice are shown as a function of time. Values indicate means ± S.E. from at least three animals per tissue and genotype ± S.E. (error bars). *, p < 0.05 in Student's t test comparing both genotypes at each time point.
FIGURE 2.
FIGURE 2.
Retinol accumulates as retinyl esters in wild type mice. A, HPLC chromatogram of non-polar retinoids extracted from a lung of a wild type mouse. RE eluted at 2.5 min, and ROL eluted at 9.2 min. The inset shows the spectrum of the retinyl ester peak. B and C, lipophilic extracts from the lungs (B) and kidneys (C) of animals injected with hRBP loaded with [3H]retinol were separated by HPLC. The flow-through was collected every 2 min (x axis), and [3H]retinol levels (y axis) were quantified with a scintillation counter. Numbers shown on the ordinate are expressed in dpm/g of tissue. Values present means ± S.E. (error bars) of data derived from at least three animals per tissue and genotype. D, serum ROL levels in WT and Lrat−/− mice. E, qRT-PCR analyses for Stra6 mRNA expression in WT and Lrat−/− mice. Values in D and E present means ± S.E. of data from at least five animals per tissue and genotype. F, immunoblot analysis for CRBP1 in the liver, lung, and white adipose tissue (WAT) of wild type and Lrat−/− mice. Representative immunoblots from two animals per genotype are shown.
FIGURE 3.
FIGURE 3.
Retinoic acid dose-dependently decreases serum holo-RBP levels in wild type mice. A, serum RBP levels in wild type mice after a single oral gavage with different doses of ATRA. A small blood sample from the tail vein was collected from each animal (n = 3 per genotype and condition) at different time points (0 h (just before treatment) and 4, 8, and 24 h after treatment). Representative immunoblot analyses for RBP in serum are shown. Albumin stained with Ponceau S was used as the loading control. B, quantification of serum RBP levels after various doses of ATRA is shown. One-way ANOVA, followed by LSD post hoc, was performed (p < 0.05), ab. Error bars, S.E.
FIGURE 4.
FIGURE 4.
Retinoic acid decreases serum holo-RBP levels in wild type but not in Lrat−/− mice. A and B, serum RBP levels in WT and Lrat−/− mice after a single oral gavage with 30 mg/kg ATRA. A small blood sample from the tail vein was collected from each animal (n = 3 per genotype and condition) at different time points (0 h (just before treatment) and 4, 8, and 24 h after treatment). A, representative immunoblot analyses for RBP in serum. Ponceau S staining for albumin was used as loading control. B, quantification of serum RBP levels in different groups. Black diamonds, vehicle-treated mice; open triangles, Lrat−/− mice treated with ATRA; open circles, WT mice treated with ATRA. One-way ANOVA, followed by LSD post hoc, was performed (p < 0.05), ab. C and D, serum RBP and ROL levels 4 h after a single gavage with 30 mg/kg ATRA and vehicle only. Serum RBP levels were quantified by immunoblot analysis (C), and ROL levels were quantified by HPLC analysis (D). As a loading control, PVDF membranes were stained with the nonspecific protein dye Ponceau S. The band selected in Fig. 3A corresponds with the molecular mass of the albumin (66 kDa). #, p < 0.0001; *, p < 0.05 for Student's t test comparing each genotype with the vehicle control. One-way ANOVA, followed by LSD post hoc, was performed (p < 0.05), ab. Error bars, S.E.
FIGURE 5.
FIGURE 5.
ATRA treatment induces Lrat and Stra6 expression in extraocular tissues of mice. WT and Lrat−/− mice (n = 4/group) were treated with 30 mg of ATRA/kg body weight or with vehicle only. After 4 h, Stra6 and Lrat mRNA expression was measured by qRT-PCR analysis, and LRAT protein levels were determined from immunoblots. A, Stra6 mRNA levels in lungs of WT mice. B, Lrat mRNA expression in lungs of WT mice. C, LRAT protein levels in lungs of WT mice. A representative immunoblot is shown on the left. D, Stra6 mRNA expression in the eyes of WT mice. E, Lrat mRNA expression in the eyes of WT mice. F, Cyp26a1 mRNA expression in the eyes of WT mice. G, Stra6 mRNA levels in adipose tissue of WT mice. H, Stra6 mRNA levels in the lungs of Lrat−/− mice. I, Stra6 mRNA levels in the eyes of Lrat−/− mice. J, Cyp26a1 mRNA expression in the eyes of Lrat−/− mice. K, Stra6 mRNA levels in adipose tissue of Lrat−/− mice. 18S was used as internal control for mRNA expression in the lung, liver, and adipose tissue, and β-actin was used in the eye. Data represent the mean ± S.E. (error bars) *, p < 0.05; Student's t test.
FIGURE 6.
FIGURE 6.
ATRA inhibits RBP release from hepatocytes. WT and Lrat−/− mice (n = 4/5 group) were treated with 30 mg of ATRA/kg body weight or the same volume of vehicle. A and B, hepatic Lrat mRNA (A) and protein levels (B) in WT mice. C, representative immunoblot analysis of hepatic RBP levels in WT and Lrat−/− mice upon vehicle and ATRA treatments. β-Actin was used as loading control. D, ROL levels in livers of WT and Lrat−/− mice. E, hepatic Rbp mRNA levels. F, HepG2 cells were preincubated with cyclohexamide (20 μg/ml) for 30 min before adding ATRA (2 μm final concentration) or vehicle only. 2 h later, ROL (2 μm final concentration) was added, and cells were incubated for an additional 2 h. Cells and medium were harvested, and RBP protein levels were determined by immunoblot analysis. Data represent means ± S.E. (error bars) from three independent experiments. *, p < 0.05; Student's t test.
FIGURE 7.
FIGURE 7.
Ocular retinoid homeostasis is maintained in mice subjected to dietary vitamin A restriction. Upon weaning, male wild type mice (n = 5/condition) were maintained on either a vitamin A-deficient or -sufficient (4000 IU of vitamin A/kg) diet. After 20 weeks, animals were sacrificed, and retinoid levels were determined in the serum and tissues. A, total retinoid levels in the liver. B, total retinoid levels in the lungs. C, total retinoid levels in the eyes. D, ROL levels in the serum.
FIGURE 8.
FIGURE 8.
Stra6 and Lrat expression is influenced by the vitamin A status of animals. Upon weaning, male wild type mice (n = 5/condition) were maintained on either a VAD or VAS (4000 IU of vitamin A/kg) diet. After 20 weeks, animals were sacrificed, and total RNA was isolated from the liver, lungs, and eyes. Stra6 and Lrat mRNA expression was measured by qRT-PCR analysis. A, Lrat mRNA levels in the liver. B, Lrat and Stra6 mRNA expression in lungs. C, Lrat and Stra6 mRNA expression in lungs. 18S ribosomal RNA was used as the internal control for mRNA expression in the lungs and liver, and β-actin was used for that in the eye. Data represent the means ± S.E. (error bars). *, p < 0.05; Student's t test.
FIGURE 9.
FIGURE 9.
FHR but not A1220 decreases RBP and retinol serum levels in a LRAT-dependent manner. A, molecular structure of the two RBP-lowering agents used, namely the synthetic retinoid FHR and A1120. B and C, serum RBP levels in wild type (B) and Lrat−/− (C) mice after a single gavage with 30 mg of FHR/kg (white squares), 30 mg of A1120/kg (black triangles), or vehicle (black diamonds). Blood samples from the tail vein of each animal were collected (n = 3/genotype and condition) at the time points shown. Representative immunoblots for serum RBP are displayed above the graphs. Ponceau S staining for albumin was used as loading control. D, after 24 h, mice were sacrificed, and serum was collected for HPLC analysis of ROL levels. As a loading control, PVDF membranes were stained with the nonspecific protein dye Ponceau S. The band selected in Fig. 7, B and C, corresponds with the molecular mass of the albumin (66 kDa). Data represent means ± S.E. (error bars) One-way ANOVA, followed by LSD post hoc, was performed (p < 0.05), ab. *, p < 0.05; Student's t test comparing the control group with each genotype.
FIGURE 10.
FIGURE 10.
Scheme of the interplay between identified components mediating cellular vitamin A uptake in peripheral tissues. In this process, LRAT enhances the cellular uptake of ROL from holo-RBP via STRA6 by converting absorbed ROL to RE. In lungs, this process is subject to regulation by all-trans-retinoic acid. In the eyes, no such regulation was observed. Moreover, RE can be further converted to 11-cis-retinol by retinal pigment epithelium protein of 65 kDa (RPE65) that displays retinoid isomerase activity.

Similar articles

Cited by

References

    1. Palczewski K. (2006) G protein-coupled receptor rhodopsin. Annu. Rev. Biochem. 75, 743–767 - PMC - PubMed
    1. Chambon P. (1996) A decade of molecular biology of retinoic acid receptors. FASEB J. 10, 940–954 - PubMed
    1. D'Ambrosio D. N., Clugston R. D., Blaner W. S. (2011) Vitamin A metabolism. An update. Nutrients 3, 63–103 - PMC - PubMed
    1. Wongsiriroj N., Piantedosi R., Palczewski K., Goldberg I. J., Johnston T. P., Li E., Blaner W. S. (2008) The molecular basis of retinoid absorption. A genetic dissection. J. Biol. Chem. 283, 13510–13519 - PMC - PubMed
    1. Paik J., Vogel S., Quadro L., Piantedosi R., Gottesman M., Lai K., Hamberger L., Vieira Mde M., Blaner W. S. (2004) Vitamin A. Overlapping delivery pathways to tissues from the circulation. J. Nutr. 134, 276S–280S - PubMed

Publication types