. 2012 Jul 27;287(31):26278-90.
doi: 10.1074/jbc.M111.291898. Epub 2012 May 27.

Subunit Interactions and cooperativity in the microtubule-severing AAA ATPase spastin

Affiliations

Subunit Interactions and cooperativity in the microtubule-severing AAA ATPase spastin

Thomas Eckert et al. J Biol Chem. .

Abstract

Spastin is a hexameric ring AAA ATPase that severs microtubules. To see whether the ring complex funnels the energy of multiple ATP hydrolysis events to the site of mechanical action, we investigate here the cooperativity of spastin. Several lines of evidence indicate that interactions among two subunits dominate the cooperative behavior: (i) the ATPase activity shows a sigmoidal dependence on the ATP concentration; (ii) ATPγS displays a mixed-inhibition behavior for normal ATP turnover; and (iii) inactive mutant subunits inhibit the activity of spastin in a hyperbolic dependence, characteristic for two interacting species. A quantitative model based on neighbor interactions fits mutant titration experiments well, suggesting that each subunit is mainly influenced by one of its neighbors. These observations are relevant for patients suffering from SPG4-type hereditary spastic paraplegia and explain why single amino acid exchanges lead to a dominant negative phenotype. In severing assays, wild type spastin is even more sensitive toward the presence of inactive mutants than in enzymatic assays, suggesting a weak coupling of ATPase and severing activity.


Figures

SCHEME 1.
SCHEME 1.
The Adair model.
SCHEME 2.
SCHEME 2.
Competitive inhibition.
SCHEME 3.
SCHEME 3.
Neighbor interaction model.
FIGURE 1.
FIGURE 1.
Model of hexameric spastin and the location of the nucleotide-binding site. The figure shows an overlay of six copies of the monomeric spastin model (Protein Data Bank entry 3B9P) onto the ATP-bound SV40 helicase model (1SVM) (21). The alternating orange and yellow coloring highlights the succession of the six protomers. The enlarged, schematic part illustrates the residues flanking the nucleotide. The lower bar illustrates the domain order of spastin and the part used for the experiments in this work. The Roman numbers refer to the domains mentioned in the Introduction.
FIGURE 2.
FIGURE 2.
Dependence of spastin activity on enzyme concentration. Shown is the steady state ATPase activity of spastin in the presence of 2 mm ATP and in the absence of microtubules (crosses). The curve fit was generated using a formula for dimer formation (Equation 4). The apparent ATP turnover per subunit increases up to ∼1.2 s−1 and reaches half-maximal velocity between 50 and 100 μm spastin.
FIGURE 3.
FIGURE 3.
Severing activity of spastin. Fluorescent Atto488-microtubules were attached to microscopic coverslips and incubated with ∼300 nm spastin and 1 mm ATP. The images are taken from supplemental Movie 2. Note that the gaps that occur between the severed microtubule ends are not due to end depolymerization but to excision of fragments severed at two ends (cf. supplemental Movie 1).
FIGURE 4.
FIGURE 4.
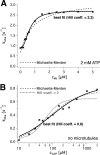
ATP turnover of wild type spastin. A, dependence of spastin's steady state ATPase rate on the microtubule concentration. The data points (black crosses) were fitted with a Hill equation (black solid line) and a Michaelis-Menten model (dashed gray line). The optimal fit parameters for this exemplary curve were kcat = 2.7 ± 0.1 s−1, with a background of kbasal = 0.9 ± 0.0 s−1, K′ = 0.36 mm microtubules, and h = 2.2 ± 0.2. For three independent measurements, the values averaged to kcat = 3.0 ± 0.2 s−1, K′ = 0.81 mm microtubules, and h = 2.2. B, sigmoidal dependence of the ATPase rate on ATP in the absence of microtubules. The logarithmic plot of the observed rate against ATP concentration shows data points (black crosses) and a fit to the Hill equation (black solid line). Comparison with a fit to the Michaelis-Menten model (dashed gray line) and the Hill model with h = 2 (gray dotted line) demonstrates that the non-cooperative Michaelis-Menten model describes the dependence almost as well as the cooperative model.
FIGURE 5.
FIGURE 5.
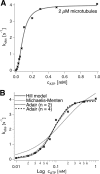
ATP dependence of spastin's ATPase. A, linear plot of the observed ATP turnover (black crosses) against the ATP concentration. The curve fit (gray line) was calculated from the Hill model and resulted in kcat = 3.9 s−1, K½ = 0.85 mm, and a Hill coefficient of h = 2.2 for the example trace. B, semilogarithmic plot of the data and a comparison of different models (cf. “Experimental Procedures”).
FIGURE 6.
FIGURE 6.
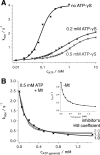
Effect of ATPγS. A, a logarithmic plot of the wild type ATPase activity (black, with fit to a Hill function as in Fig. 4A) is compared with the turnover in the presence of 0.2 and 0.5 mm ATPγS. It shows an increase of the ATP concentration required for half-maximal activation and a roughly 2.5-fold decrease of kmax in the presence of 0.5 mm ATPγS. The Hill coefficients are h = 0.91 (0.2 mm ATPγS) and 1.35 (0.5 mm ATPγS). B, inhibition of ATP turnover by ATPγS in the presence of a fixed ATP concentration (0.5 mm). The best fit was achieved by a non-competitive inhibition model (Equation 10) with Km,ATP ∼145 μm and KI,ATPγS ∼180 μm (black line). The assumption that the inhibitor binds cooperatively with Hill coefficients of 1.5 (dark gray) and 2.0 (light gray) according to Equation 12 led to systematic errors. All assays were preformed in the presence of 2 μm microtubules (saturating conditions). The inset shows the experimental data in the absence of microtubules. The fitted kmax was 0.77 ± 0.05 s−1 at 0 mm ATPγS, Km,ATP = 84 ± 4 μm, KI,ATPγS = 131 ± 12 μm, the curve fit (black line) extrapolated to 0.04 ± 0.01 s−1 at infinite ATPγS concentration (kcat,I, Scheme 2).
FIGURE 7.
FIGURE 7.
Inhibition of wild type spastin by inactive E442Q mutant subunits. The enzymatic activity of 5.9·10−7 m wild type spastin (vertical dashed line) was measured in the presence of increasing amounts of inactive mutant. The data (crosses) were fitted to the model developed for Scheme 2 (“neighbor inhibition”; black line). For comparison, hypothetical models assuming that one, two, or three inactive subunits reduce the activity of the entire hexameric ring to a basal level (taken from extrapolation of the data to infinity) are shown as gray lines.
FIGURE 8.
FIGURE 8.
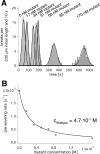
Influence of inactive E442Q mutants on severing activity. A, a time line along which histograms of microtubule severing events are recorded. Different grey densities indicate the presence of different amounts of mutant in the presence of 470 nm wild type; black lines are Gaussian fits for each condition. B, plots the reciprocal of the times in A as severing rates against the mutant concentration. The data were fitted to the neighbor interaction model (Equation 25; black line).
FIGURE 9.
FIGURE 9.
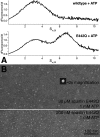
A, analytical ultracentrifugation. The sedimentation velocity of 1 μm spastin labeled with Atto488 fluorophore was followed in a sedimentation velocity ultracentrifuge run. The graphs show the C(s) analysis of fluorescence against the sedimentation coefficient, calculated from the sedimentation velocities in the software package UltraScan (36). Wild type spastin in the presence of ATP sediments with an S value of 3.1, corresponding to 44–46 kDa. In contrast, the E442Q mutant also sediments as a 6.4 S species, corresponding to ∼125 kDa. B, negative stain electron micrographs of spastin. The figure compares preparations of low and high concentrations of spastin E442Q in the presence of ATP. At high concentrations, ring structures are visible that show clear hexameric shape after particle averaging (inset).

Similar articles

Cited by

References

    1. Errico A., Claudiani P., D'Addio M., Rugarli E. I. (2004) Spastin interacts with the centrosomal protein NA14 and is enriched in the spindle pole, the midbody, and the distal axon. Hum. Mol. Genet. 13, 2121–2132 - PubMed
    1. Evans K. J., Gomes E. R., Reisenweber S. M., Gundersen G. G., Lauring B. P. (2005) Linking axonal degeneration to microtubule remodeling by Spastin-mediated microtubule severing. J. Cell Biol. 168, 599–606 - PMC - PubMed
    1. Svenson I. K., Kloos M. T., Jacon A., Gallione C., Horton A. C., Pericak-Vance M. A., Ehlers M. D., Marchuk D. A. (2005) Subcellular localization of spastin. Implications for the pathogenesis of hereditary spastic paraplegia. Neurogenetics 6, 135–141 - PubMed
    1. Zhang D., Rogers G. C., Buster D. W., Sharp D. J. (2007) Three microtubule severing enzymes contribute to the “Pacman-flux” machinery that moves chromosomes. J. Cell Biol. 177, 231–242 - PMC - PubMed
    1. Confalonieri F., Duguet M. (1995) A 200-amino acid ATPase module in search of a basic function. BioEssays 17, 639–650 - PubMed

Publication types

MeSH terms