Review
. 2012 Oct;41(10):789-99.
doi: 10.1007/s00249-012-0820-x. Epub 2012 May 26.

Validation of macromolecular flexibility in solution by small-angle X-ray scattering (SAXS)

Affiliations
Review

Validation of macromolecular flexibility in solution by small-angle X-ray scattering (SAXS)

Michal Hammel. Eur Biophys J. 2012 Oct.

Abstract

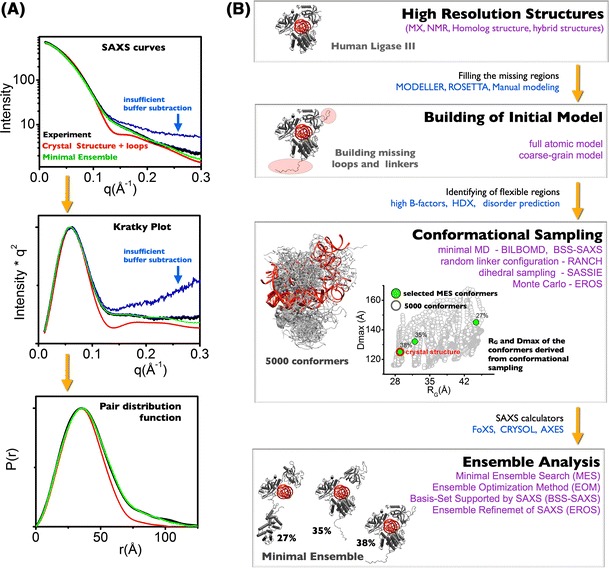
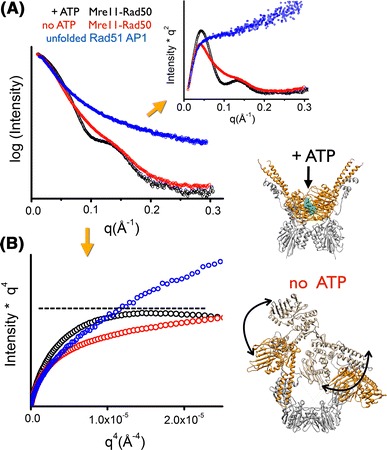
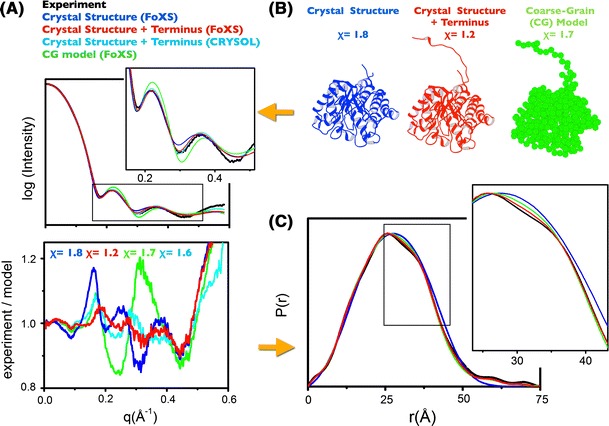
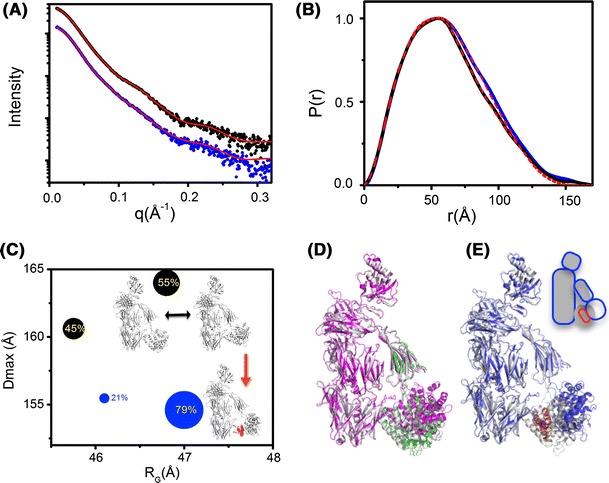
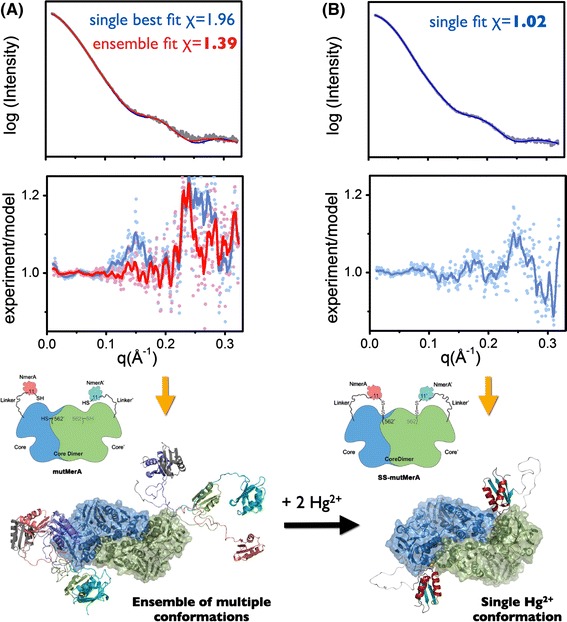
The dynamics of macromolecular conformations are critical to the action of cellular networks. Solution X-ray scattering studies, in combination with macromolecular X-ray crystallography (MX) and nuclear magnetic resonance (NMR), strive to determine complete and accurate states of macromolecules, providing novel insights describing allosteric mechanisms, supramolecular complexes, and dynamic molecular machines. This review addresses theoretical and practical concepts, concerns, and considerations for using these techniques in conjunction with computational methods to productively combine solution-scattering data with high-resolution structures. I discuss the principal means of direct identification of macromolecular flexibility from SAXS data followed by critical concerns about the methods used to calculate theoretical SAXS profiles from high-resolution structures. The SAXS profile is a direct interrogation of the thermodynamic ensemble and techniques such as, for example, minimal ensemble search (MES), enhance interpretation of SAXS experiments by describing the SAXS profiles as population-weighted thermodynamic ensembles. I discuss recent developments in computational techniques used for conformational sampling, and how these techniques provide a basis for assessing the level of the flexibility within a sample. Although these approaches sacrifice atomic detail, the knowledge gained from ensemble analysis is often appropriate for developing hypotheses and guiding biochemical experiments. Examples of the use of SAXS and combined approaches with X-ray crystallography, NMR, and computational methods to characterize dynamic assemblies are presented.


Figures

Fig. 1
Fig. 1
Validation of flexibility using SAXS curve (a) and rigid-body modeling (b). a Experimental SAXS profiles (black and blue) for the human DNA Ligase III (Cotner-Gohara et al. 2010) in a match with theoretical profiles calculated for the crystal structure (red) (Cotner-Gohara et al. 2010) and its dynamic model (green) obtained by BILBOMD and MES (Pelikan et al. 2009). The Kratky plot is used as the initial indicator of the flexibility. Baseline convergence necessary for assessing flexibility is misleading for the SAXS curve with insufficient buffer subtraction (gray). Pair distribution P(r) function calculated for the experimental (black) and the theoretical SAXS (red, cyan). Crystal structure, full-length and ensemble models used to calculate theoretical SAXS profiles are shown in the panel a (data adapted from Cotner-Gohara et al. 2010). b Schematic diagram of typical rigid-body modeling performing building of initial model, conformational sampling, and ensemble analysis
Fig. 2
Fig. 2
Detecting conformational flexibility. a SAXS data for the Mre11–Rad50 complex in both the presence (black), and absence (red) of ATP (Williams et al. 2011), and an exemplary intrinsically disordered domain Rad51 AP1 (blue). Inset Comparison of the Kratky plots for Mre11–Rad50 complexes does not confidently demonstrate flexibility of the complex in the absence of ATP (black and red). However, the Kratky plot of Rad51 AP1 (blue) is hyperbolic in shape, clearly demonstrating the full unfolded particle. b Porod–Debye plot illustrating changes in the Porod–Debye region. Loss of the plateau suggests Mre11–Rad50 becomes more flexible in the absence of ATP. Rigid and flexible states of Mre11–Rad50 are presented with crystal structure of Mre11–Rad50-ATPγS (Lim et al. 2011) and dynamic model of Mre11–Rad50 (Williams et al. 2011) (left panel). Data were adapted from Williams et al. (2011) and Rambo and Tainer (2011). Data for Rad51 AP1 were kindly provided by Gareth Williams at the Lawrence Berkeley National Laboratory
Fig. 3
Fig. 3
Accuracy of SAXS-profile calculations. a Comparison of the experimental scattering curves of cellulase Cel5A catalytic domain (black) with the theoretical curves for Cel5A crystal structure missing the C-terminal unfolded region (PDB 1EDG) (blue), full-atomistic model (red), and coarse-grain (CG) model (green), shown in panel b. Bottom panel The discrepancy between theoretical and experimental profiles is calculated as Intensity(experiment)/Intensity(model). Please note the large discrepancy for the CG model (χ = 1.7) and crystal structure (χ = 1.8) in comparison with the full-atomistic model calculated by FoXS (χ = 1.2). Better profile matches are obtained by calculating explicit atom distances (FoXS χ = 1.2) in comparison with the SAXS profile calculated by spherical harmonics using CRYSOL—Linux version 2.7 (χ = 1.6). c P(r) functions calculated for SAXS profiles shown in a have been calculated by use of the software GNOM (Svergun 1992). The production and purification of the cellulase Cel5A catalytic domain has been described elsewhere (Fierobe et al. 2002). SAXS experiments were performed at the European Synchrotron Radiation Facility (Grenoble, France) on beamline ID02 as described by (Hammel et al. 2004a)
Fig. 4
Fig. 4
Efb-induced conformational changes in human complement C3b as revealed by SAXS. a Experimental scattering curves for free C3b (black) and in the complex with extracellular fibrinogen-binding protein (Efb) from Staphylococcus aureus (C3b/Efb) (blue) were fit to MES model (red line). b P(r) functions indicate conformational changes between C3b (black) and C3b/Efb (blue), where broadening of P(r) for C3b/Efb-C is consistent with reorientation of the CUB-TED domain. P(r) from the atomic MES models is shown as a red dashed line. c Comparison of R G for the two predominant MES conformers of either C3b (black) or C3b/Efb (blue) as obtained by BILBOMD sampling with their maximum dimensions (D max). Dot sizes represent the fraction ratio of the two conformers in each group. Rigid-body modeling-derived C3b conformers are shown in gray with Efb highlighted in red. (d, e) Superposition of the BILBOMD-MES-derived conformers of free C3b (d, magenta and green) and C3b/Efb (e, blue/red) with the crystal structure of C3b (gray). The inset shows a schematic representation of the proposed domain rearrangements. Data were adapted from Chen et al. (2010)
Fig. 5
Fig. 5
Solution structure modeling of intramolecular Hg2+ transfer between flexibly linked domains of mercuric ion reductase (MerA). a Comparison of experimental and calculated scattering profiles for full-length MerA (mutMerA). Experimental SAXS data (gray), single best-fit conformation to the experimental scattering profile with χ = 1.96 (blue line), and combined profile from five contributing conformations identified by MES (red line) with χ = 1.39. Residuals calculated as I experiment/I model are shown at the bottom. Superposition of the five models identified by MES with the metallochaperone-like N-terminal domains in a different color weighted by the factors 0.40 (pink), 0.29 (green), 0.16 (cyan), 0.08 (purple), and 0.07 (gray). b Experimental SAXS data for the disulfide-cross-linked handoff complex (SS–mutMerA) (gray) and calculated scattering data for the single best-fit conformation χ = 1.02 (blue line). Residuals I experiment/I model are shown as blue dots and as a blue line for smooth residuals. Inset shows the schematic representation of mutMerA and S–S-mutMerA. Data were adapted from Johs et al. (2011)

References

    1. Abe Y, Gor J, Bracewell DG, Perkins SJ, Dalby PA. Masking of the Fc region in human IgG4 by constrained X-ray scattering modelling: implications for antibody function and therapy. Biochem J. 2010;432:101–111. doi: 10.1042/BJ20100641. - DOI - PubMed
    1. Akiyama S, Fujisawa T, Ishimori K, Morishima I, Aono S. Activation mechanisms of transcriptional regulator CooA revealed by small-angle X-ray scattering. J Mol Biol. 2004;341:651–668. doi: 10.1016/j.jmb.2004.06.040. - DOI - PubMed
    1. Aslam M, Perkins SJ. Folded-back solution structure of monomeric factor H of human complement by synchrotron X-ray and neutron scattering, analytical ultracentrifugation and constrained molecular modelling. J Mol Biol. 2001;309:1117–1138. doi: 10.1006/jmbi.2001.4720. - DOI - PubMed
    1. Bernado P. Effect of interdomain dynamics on the structure determination of modular proteins by small-angle scattering. Eur Biophys J. 2010;39:769–780. doi: 10.1007/s00249-009-0549-3. - DOI - PubMed
    1. Bernado P, Blackledge M. Structural biology: proteins in dynamic equilibrium. Nature. 2010;468:1046–1048. doi: 10.1038/4681046a. - DOI - PubMed

Publication types

LinkOut - more resources