. 2012 Feb 20:3:33.
doi: 10.3389/fpls.2012.00033. eCollection 2012.

Annotation of Selaginella moellendorffii Major Intrinsic Proteins and the Evolution of the Protein Family in Terrestrial Plants

Affiliations

Annotation of Selaginella moellendorffii Major Intrinsic Proteins and the Evolution of the Protein Family in Terrestrial Plants

Hanna I Anderberg et al. Front Plant Sci. .

Abstract

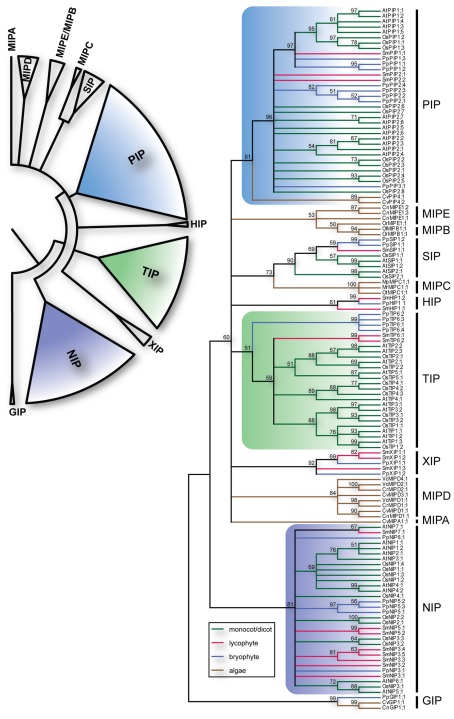
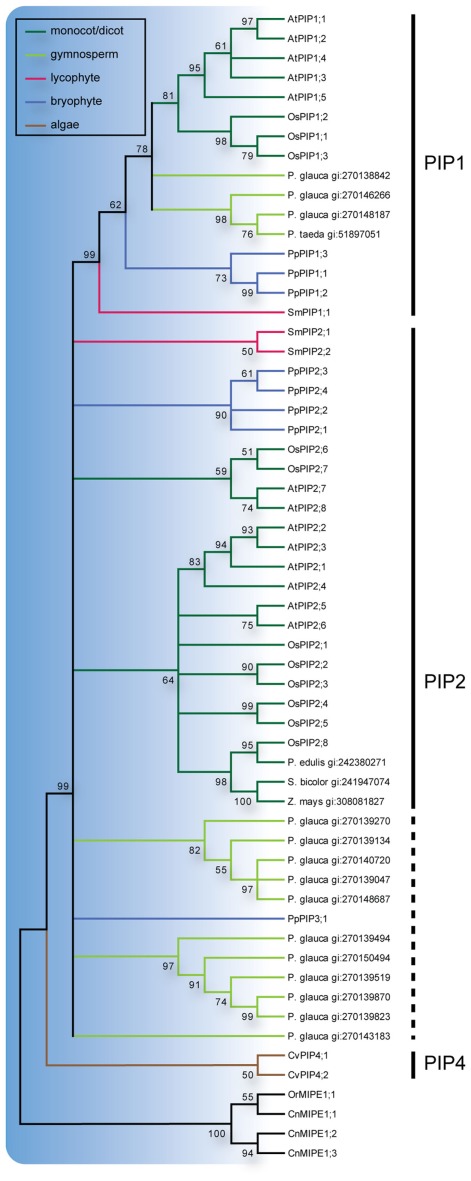
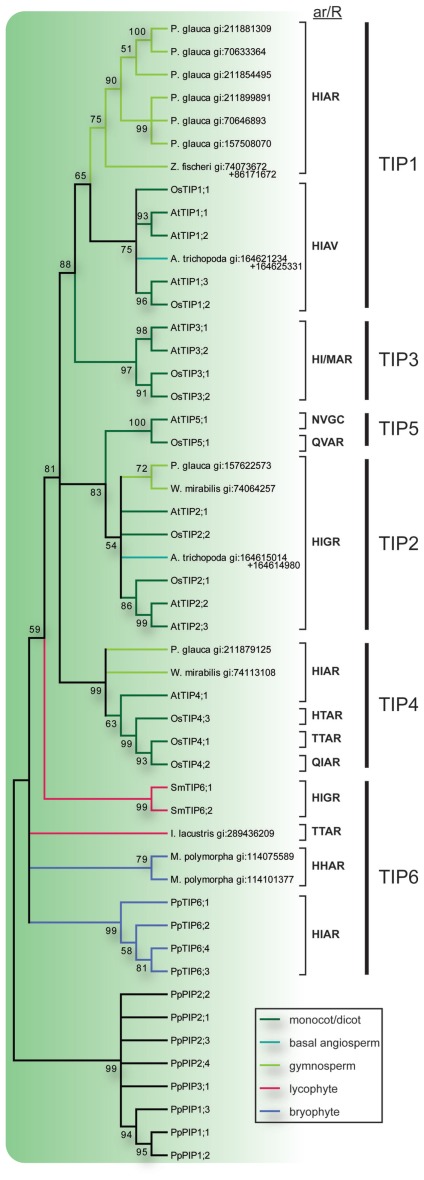
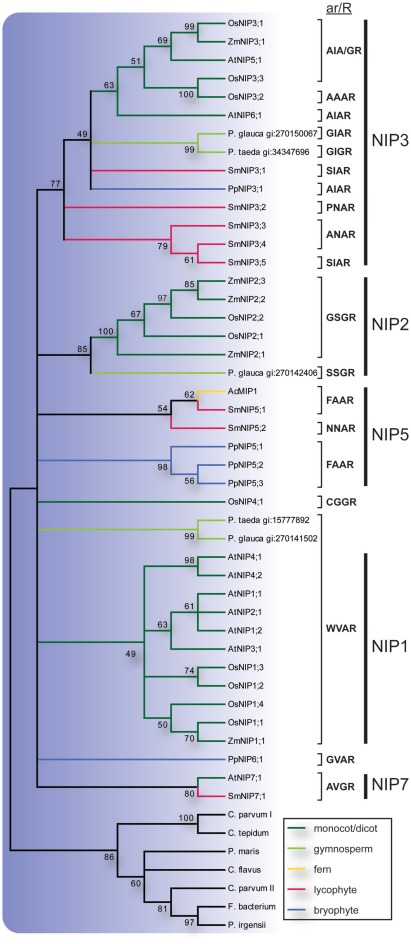
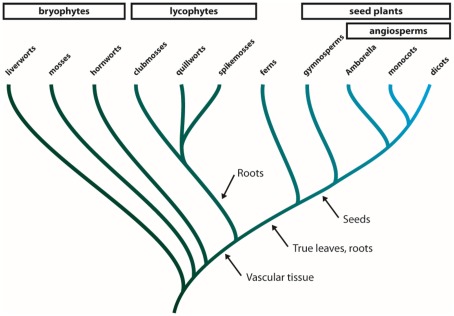
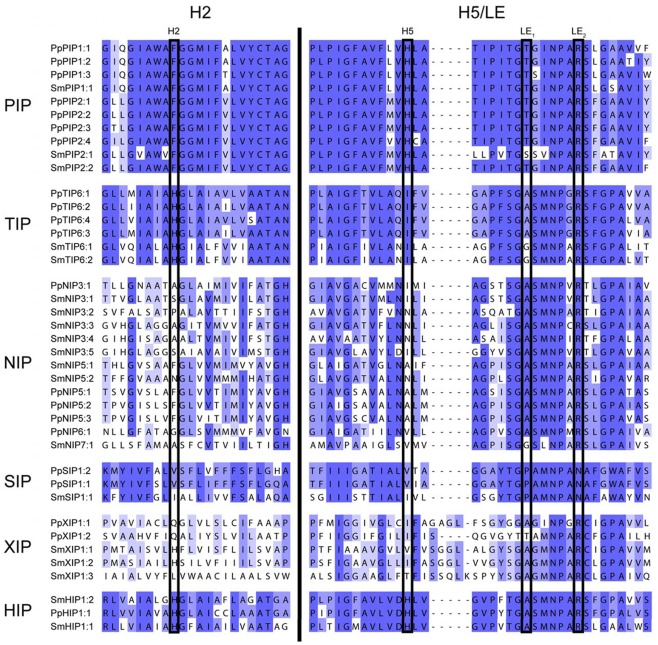
Major intrinsic proteins (MIPs) also called aquaporins form pores in membranes to facilitate the permeation of water and certain small polar solutes across membranes. MIPs are present in virtually every organism but are uniquely abundant in land plants. To elucidate the evolution and function of MIPs in terrestrial plants, the MIPs encoded in the genome of the spikemoss Selaginella moellendorffii were identified and analyzed. In total 19 MIPs were found in S. moellendorffii belonging to 6 of the 7 MIP subfamilies previously identified in the moss Physcomitrella patens. Only three of the MIPs were classified as members of the conserved water specific plasma membrane intrinsic protein (PIP) subfamily whereas almost half were found to belong to the diverse NOD26-like intrinsic protein (NIP) subfamily permeating various solutes. The small number of PIPs in S. moellendorffii is striking compared to all other land plants and no other species has more NIPs than PIPs. Similar to moss, S. moellendorffii only has one type of tonoplast intrinsic protein (TIP). Based on ESTs from non-angiosperms we conclude that the specialized groups of TIPs present in higher plants are not found in primitive vascular plants but evolved later in a common ancestor of seed plants. We also note that the silicic acid permeable NIP2 group that has been reported from angiosperms appears at the same time. We suggest that the expansion of the number MIP isoforms in higher plants is primarily associated with an increase in the different types of specialized tissues rather than the emergence of vascular tissue per se and that the loss of subfamilies has been possible due to a functional overlap between some subfamilies.

Keywords: AQP; GIP; HIP; SIP; XIP; phylogeny; water channels.


Figures

Figure 1
Figure 1
Phylogeny of MIPs. The upper left panel summarize the different subfamilies of plant MIPs. The right panel depicts the bootstrap consensus tree of the complete set of MIPs from O. sativa (Os), A. thaliana (At), S. moellendorffii (Sm), P. patens (Pp) and the chlorophyte algae Chlamydomonas reinhardtii (Cr), Volvox carteri (Vc), Coccomyxa sp. C-169 (Cc), Chlorella sp. NC64A (Cn), Micromonas pusilla CCMP1545 (Mp), Micromonas sp. RCC299 (Mr), Ostreococcus lucimarinus (Ol), Ostreococcus sp. RCC809 (Or), and Ostreococcus tauri (Ot) using the Maximum Likelihood method. The branches are colored according to from what phyla the sequences are derived. The numbers by the nodes are bootstrap support in percentage and nodes with less the 50% support are collapsed. The vertical lines to the right delimit the different subfamilies.
Figure 2
Figure 2
Phylogeny of PIPs. Maximum Likelihood bootstrap consensus tree of PIPs from plant species with sequenced genomes together with PIP-like sequences retrieved from the NCBI EST database. EST sequences are named with species name followed by their GenBank gi numbers. The PIP branches are color coded according to from what phyla the sequences are derived. Subgroups are delimited by the vertical lines to the left where the dashed line indicates sequences for which classification is uncertain. The robustness of nodes is denoted with bootstrap support in percentage and nodes with less than 50% support are collapsed.
Figure 3
Figure 3
Phylogeny of TIPs. The bootstrap consensus tree resulting from a Maximum Likelihood analysis of the TIPs of species with sequenced genome along with full length TIP-like EST sequences retrieved from the NCBI EST database. EST sequences are named with species name and GenBank gi number. In the case where two ESTs were used to compile a full length MIP sequence both GenBank gi numbers are provided. Selectivity filters (ar/R) are displayed next to the sequence names and the vertical lines to the right indicate the subgroup to which they belong. The TIP branches are color coded according to from what phyla the sequences are derived. Nodes with less than 50% bootstrap support are collapsed.
Figure 4
Figure 4
Phylogeny of NIPs. The bootstrap consensus tree resulting from a Maximum Likelihood analysis of the NIPs of species with sequenced genome along with full length NIP-like EST sequences retrieved from the NCBI EST database. EST sequences are named with species name and GenBank gi number. Selectivity filters (ar/R) are displayed next to the sequence names and the vertical lines to the right indicate the subgroup to which they belong. The NIP branches are color coded according to from what phyla the sequences are derived. Nodes with less than 49% bootstrap support are collapsed.
Figure A1
Figure A1
Phylogeny of land plants. The land plants (embryophytes) can be divided into four groups. The bryophytes are a paraphyletic group comprised of the three earliest diverging lineages of land plants, i.e., the liverworts, mosses, and hornworts. The next group to diverge is the monophyletic lycophytes that consists of clubmosses, quillworts, and spikemosses and further up the tree the ferns represent a lineage diverging just before the emergence of seed plants. The seed plants are divided into two groups, the gymnosperms and the angiosperms (flowering plants). Within the angiosperms Amborella is thought to be the earliest diverging genus. Arrows indicate important morphological changes during the evolution of land plants.
Figure A2
Figure A2
Alignment of regions determining the ar/R filter. Two regions of the alignment, helix 2 (H2) and helix 5/loop E (H5/LE) separated by a black bar, containing the four residues of the ar/R selectivity filter (boxed). All MIPs of S. moellendorffii and P. patens are included in the alignment. The blue shading reflects the degree of conservation within each subfamily.

References

    1. Alexandersson E., Fraysse L., Sjovall-Larsen S., Gustavsson S., Fellert M., Karlsson M., Johanson U., Kjellbom P. (2005). Whole gene family expression and drought stress regulation of aquaporins. Plant Mol. Biol. 59, 469–48410.1007/s11103-005-0352-1 - DOI - PubMed
    1. Ali W., Isayenkov S. V., Zhao F. J., Maathuis F. J. (2009). Arsenite transport in plants. Cell. Mol. Life Sci. 66, 2329–233910.1007/s00018-009-0021-7 - DOI - PMC - PubMed
    1. Anderberg H. I., Danielson J. A., Johanson U. (2011). Algal MIPs, high diversity and conserved motifs. BMC Evol. Biol. 11, 110.10.1186/1471-2148-11-110 - DOI - PMC - PubMed
    1. Azad A. K., Yoshikawa N., Ishikawa T., Sawa Y., Shibata H. (2011). Substitution of a single amino acid residue in the aromatic/arginine selectivity filter alters the transport profiles of tonoplast aquaporin homologs. Biochim. Biophys. Acta 1818, 1–11 - PubMed
    1. Banks J. A. (2009). Selaginella and 400 million years of separation. Annu. Rev. Plant Biol. 60, 223–23810.1146/annurev.arplant.59.032607.092851 - DOI - PubMed