

Glucose transporter/T1R3-expressing cells in rat tracheal epithelium
- PMID: 22640462
- PMCID: PMC3406361
- DOI: 10.1111/j.1469-7580.2012.01522.x
Glucose transporter/T1R3-expressing cells in rat tracheal epithelium
Abstract
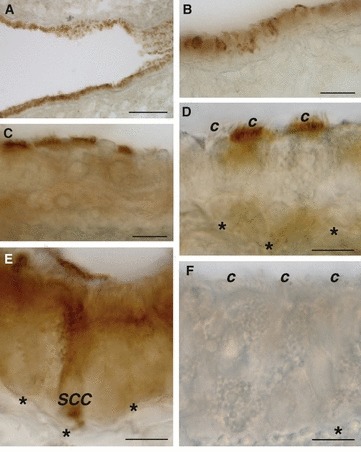
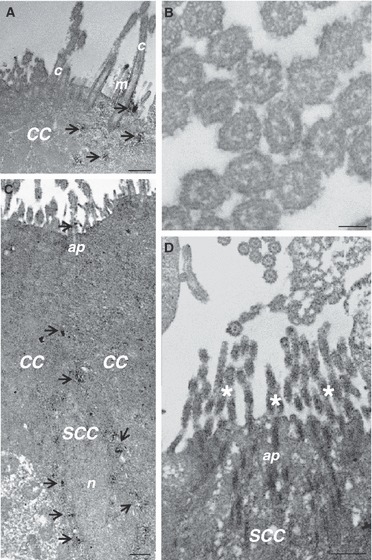
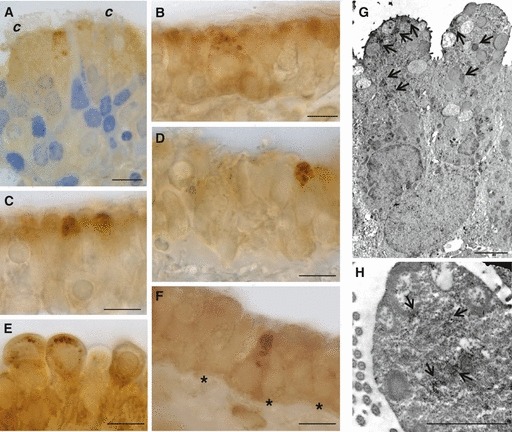
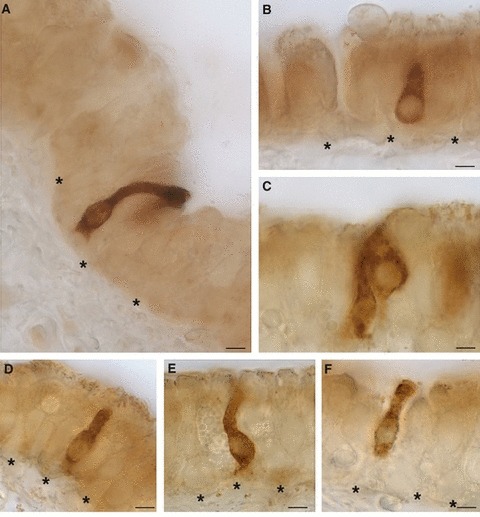
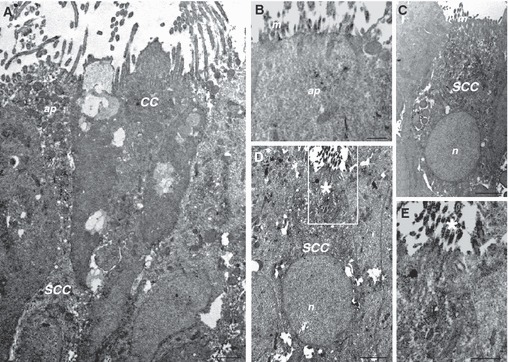
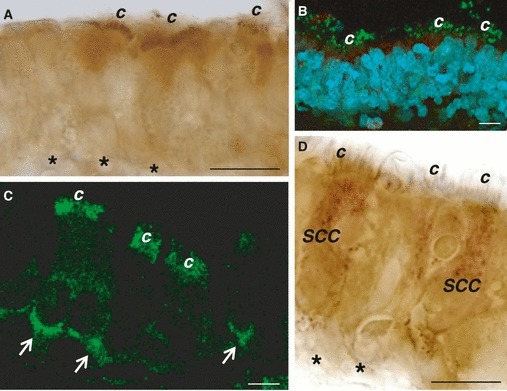
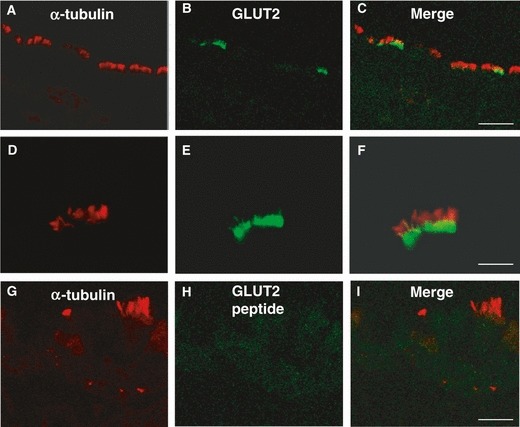
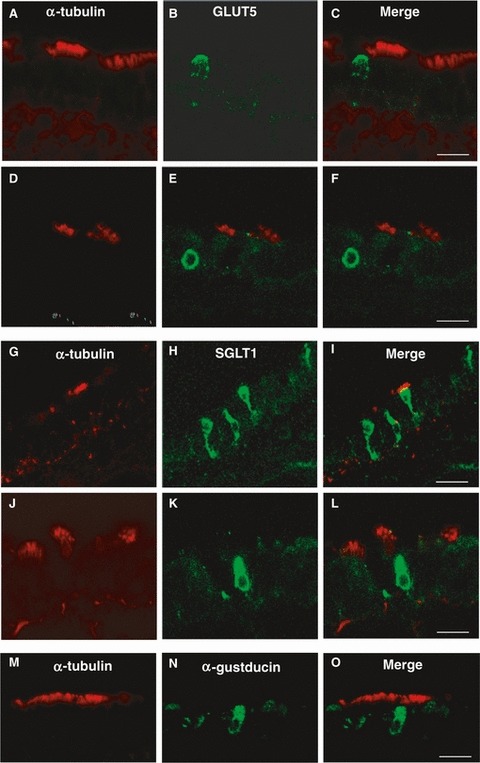
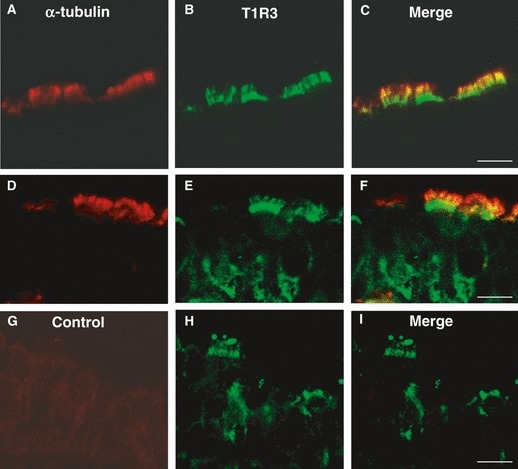
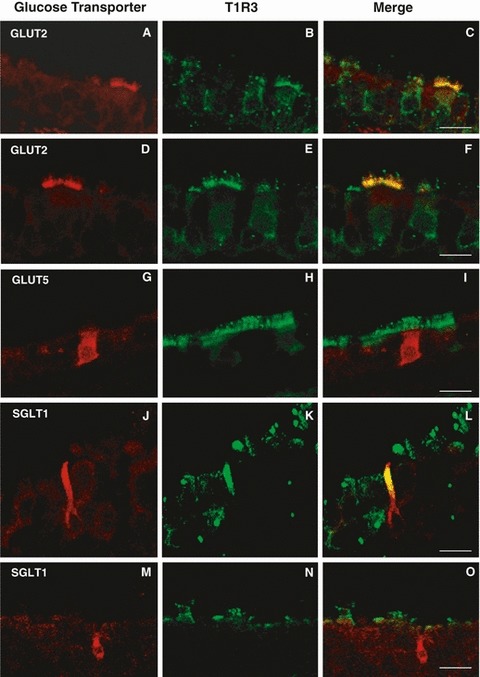
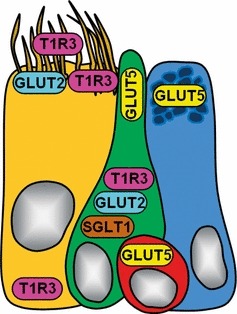
Glucose transport plays an important role in maintaining low sugar concentration in airway surface liquid (ASL), which is critical for mucociliary clearance and bacterial colonization. Experimental evidence indicates that glucose/hexose uptake in lung/airway cells occurs by means of two structurally distinct glucose transporter pathways: the Na(+) -dependent glucose transporters (SGLT family) and the facilitative glucose transporters (GLUT family). In this study, we examined the expression of the major glucose transporters of the intestine, GLUT2, GLUT5, SGLT1 and T1R3 taste receptor subunit, in the trachea of rats using immunohistochemistry and immunoelectron microscopy, and compared them using double-labeled confocal microscopy. We found that GLUT2, GLUT5, SGLT1 and T1R3 are selectively expressed in different cell types. T1R3 and GLUT2 are predominantly expressed in subsets of solitary chemoreceptor cells (SCCs) and ciliated cells, GLUT5 is present in subsets of SCCs and in secretory cells, and SGLT1 is exclusively expressed in a unique cell type, SCCs. Furthermore, we demonstrated that T1R3 is colocalized with SGLT1 in SCCs and with GLUT2 transporter in ciliated cells. In conclusion, these findings reveal that different cell types are associated with the uptake of glucose in ASL and that, due to their T1R3 expression, SCCs and ciliated cells are most likely to participate in the chemosensory process in ASL.
© 2012 The Authors. Journal of Anatomy © 2012 Anatomical Society.
Figures
Similar articles
-
Molecules implicated in glucose homeostasis are differentially expressed in the trachea of lean and obese Zucker rats.Eur J Histochem. 2016 Feb 1;60(1):2557. doi: 10.4081/ejh.2016.2557. Eur J Histochem. 2016. PMID: 26972710 Free PMC article.
-
Glucose transporters are expressed in taste receptor cells.J Anat. 2011 Aug;219(2):243-52. doi: 10.1111/j.1469-7580.2011.01385.x. Epub 2011 May 17. J Anat. 2011. PMID: 21592100 Free PMC article.
-
Glucose transporters in the small intestine in health and disease.Pflugers Arch. 2020 Sep;472(9):1207-1248. doi: 10.1007/s00424-020-02439-5. Epub 2020 Aug 23. Pflugers Arch. 2020. PMID: 32829466 Free PMC article. Review.
-
Luminal Sweet Sensing and Enteric Nervous System Participate in Regulation of Intestinal Glucose Transporter, GLUT2.Nutrients. 2025 Apr 30;17(9):1547. doi: 10.3390/nu17091547. Nutrients. 2025. PMID: 40362862 Free PMC article.
-
Getting sweeter: new evidence for glucose transporters in specific cell types of the airway?Am J Physiol Cell Physiol. 2023 Jan 1;324(1):C153-C166. doi: 10.1152/ajpcell.00140.2022. Epub 2022 Nov 21. Am J Physiol Cell Physiol. 2023. PMID: 36409177 Free PMC article. Review.
Cited by
-
Bitter tastants and artificial sweeteners activate a subset of epithelial cells in acute tissue slices of the rat trachea.Sci Rep. 2019 Jun 20;9(1):8834. doi: 10.1038/s41598-019-45456-w. Sci Rep. 2019. PMID: 31222082 Free PMC article.
-
Chemosensory brush cells of the trachea. A stable population in a dynamic epithelium.Am J Respir Cell Mol Biol. 2013 Aug;49(2):190-6. doi: 10.1165/rcmb.2012-0485OC. Am J Respir Cell Mol Biol. 2013. PMID: 23526223 Free PMC article.
-
Molecules implicated in glucose homeostasis are differentially expressed in the trachea of lean and obese Zucker rats.Eur J Histochem. 2016 Feb 1;60(1):2557. doi: 10.4081/ejh.2016.2557. Eur J Histochem. 2016. PMID: 26972710 Free PMC article.
-
Sugar type and route of delivery influence insulin and glucose-dependent insulinotropic polypeptide responses in rats.Am J Physiol Endocrinol Metab. 2025 Aug 1;329(2):E210-E225. doi: 10.1152/ajpendo.00460.2024. Epub 2025 Jun 25. Am J Physiol Endocrinol Metab. 2025. PMID: 40560801 Free PMC article.
-
SGLT1 sugar transporter/sensor is required for post-oral glucose appetition.Am J Physiol Regul Integr Comp Physiol. 2016 Apr 1;310(7):R631-9. doi: 10.1152/ajpregu.00432.2015. Epub 2016 Jan 20. Am J Physiol Regul Integr Comp Physiol. 2016. PMID: 26791832 Free PMC article.
References
MeSH terms
Substances
LinkOut - more resources
Full Text Sources
