

Inferring biochemical reaction pathways: the case of the gemcitabine pharmacokinetics
- PMID: 22640931
- PMCID: PMC3536593
- DOI: 10.1186/1752-0509-6-51
Inferring biochemical reaction pathways: the case of the gemcitabine pharmacokinetics
Abstract
Background: The representation of a biochemical system as a network is the precursor of any mathematical model of the processes driving the dynamics of that system. Pharmacokinetics uses mathematical models to describe the interactions between drug, and drug metabolites and targets and through the simulation of these models predicts drug levels and/or dynamic behaviors of drug entities in the body. Therefore, the development of computational techniques for inferring the interaction network of the drug entities and its kinetic parameters from observational data is raising great interest in the scientific community of pharmacologists. In fact, the network inference is a set of mathematical procedures deducing the structure of a model from the experimental data associated to the nodes of the network of interactions. In this paper, we deal with the inference of a pharmacokinetic network from the concentrations of the drug and its metabolites observed at discrete time points.
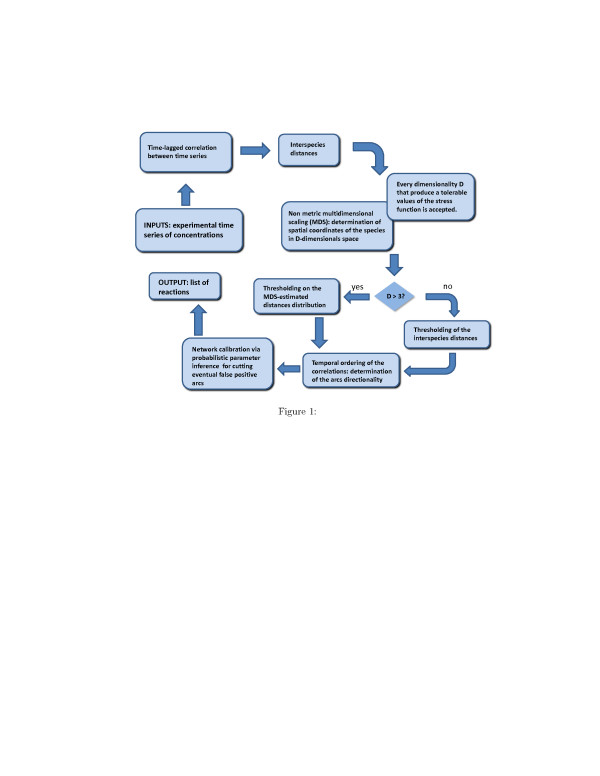
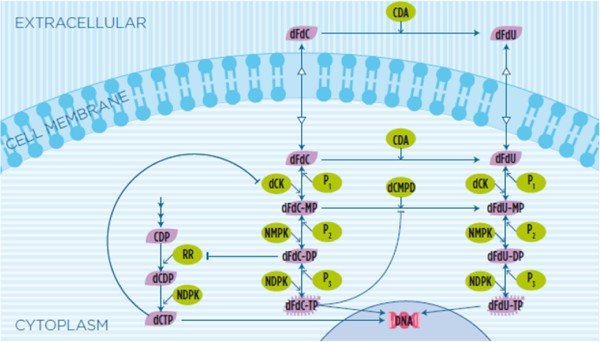
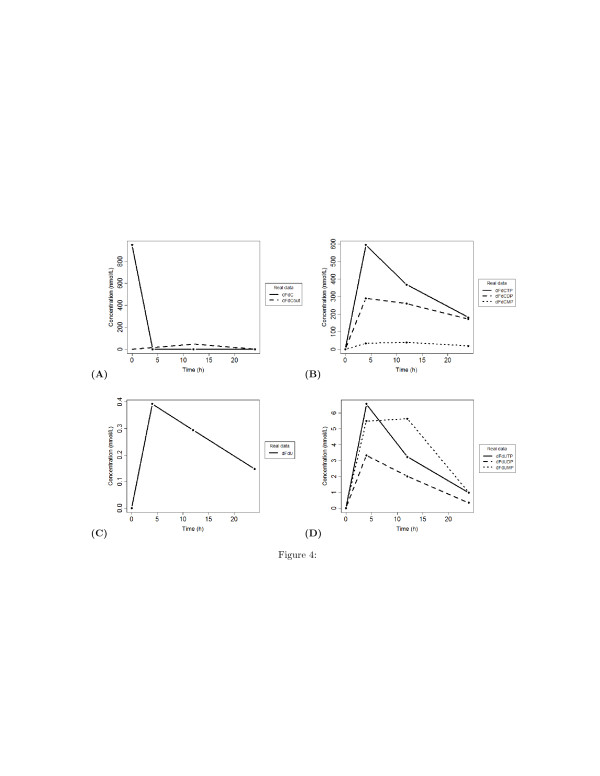
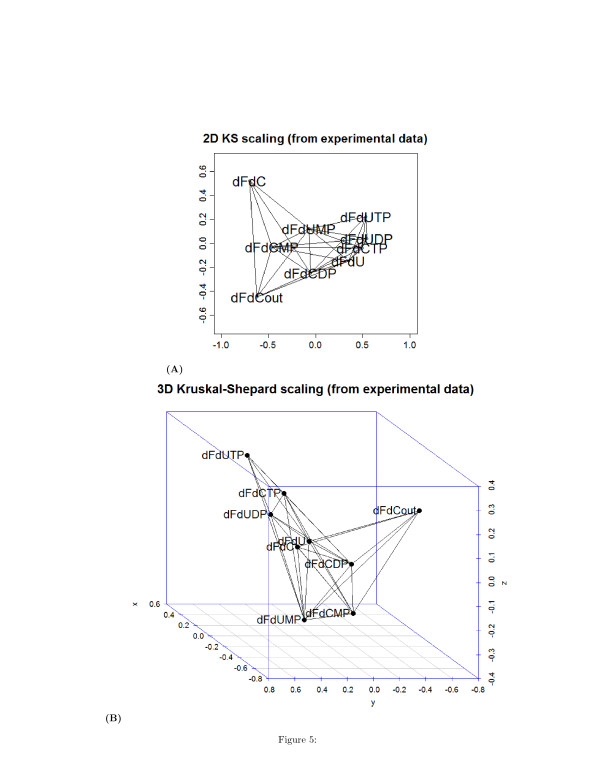
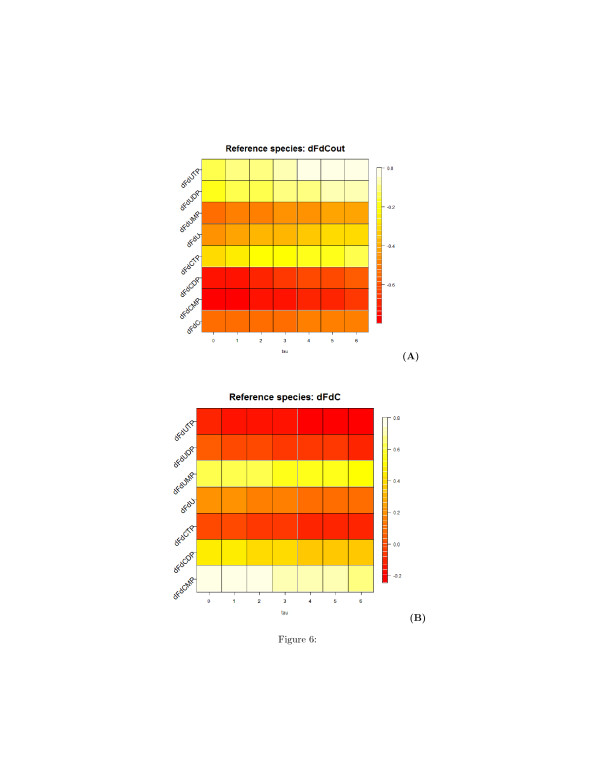
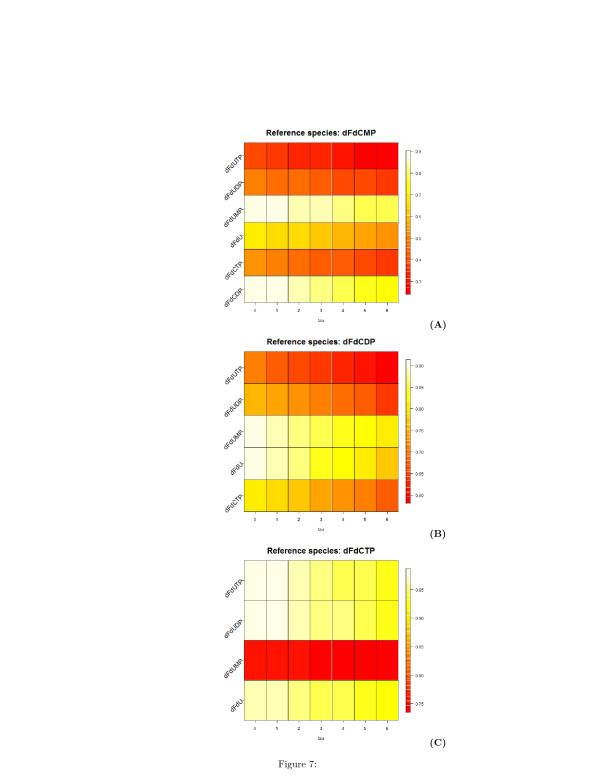
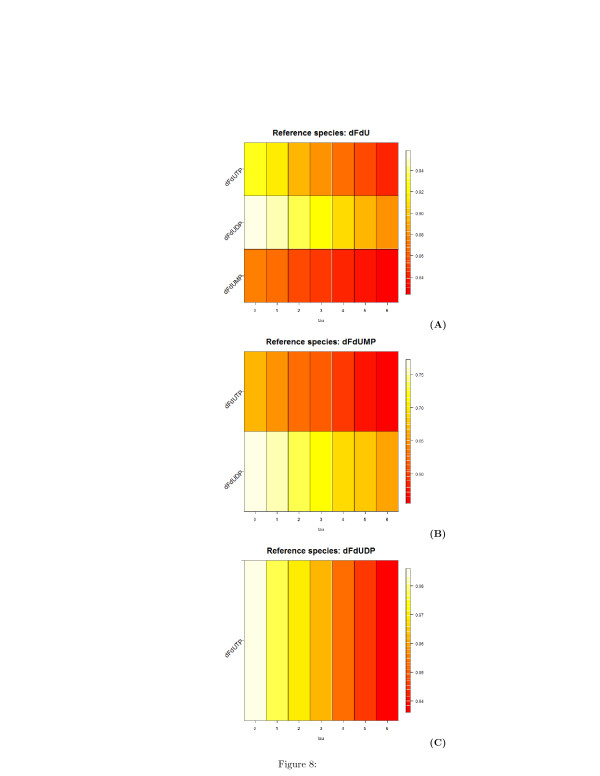
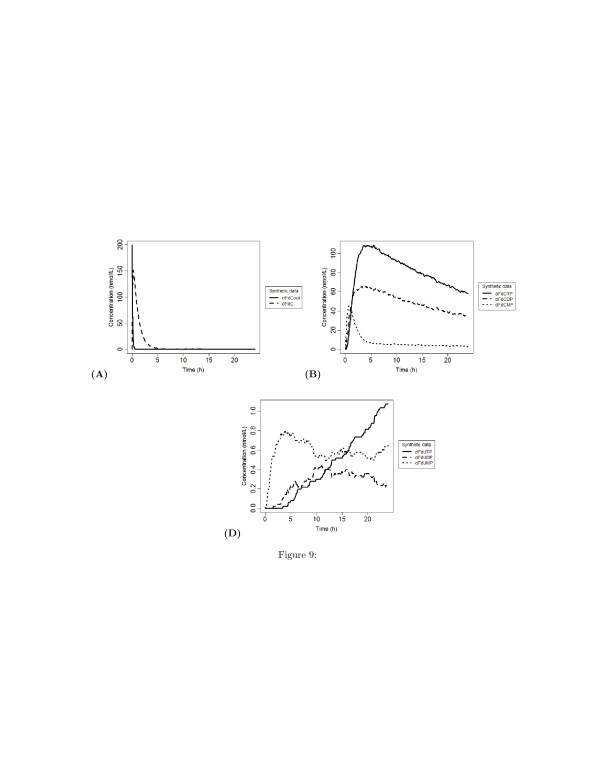
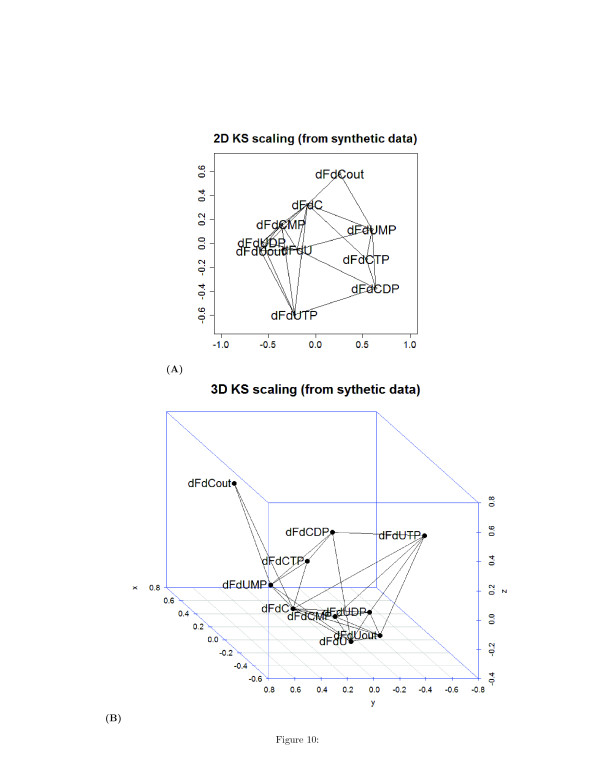
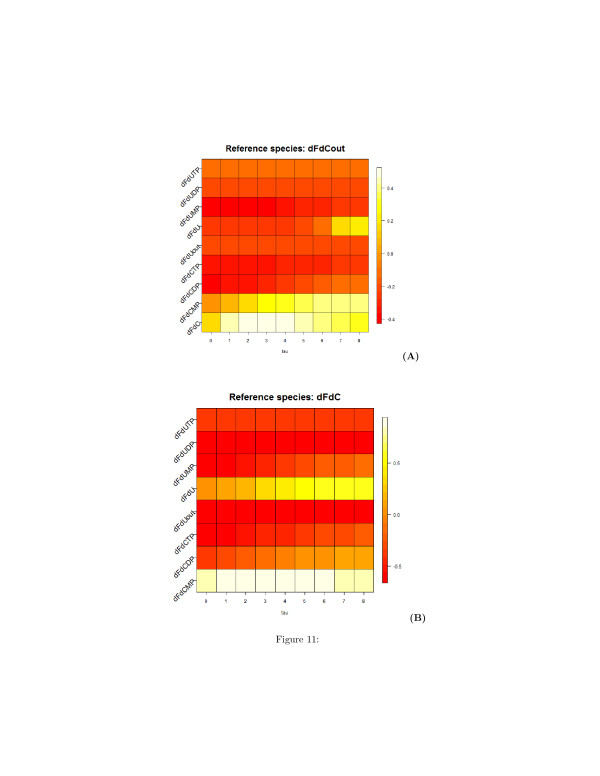
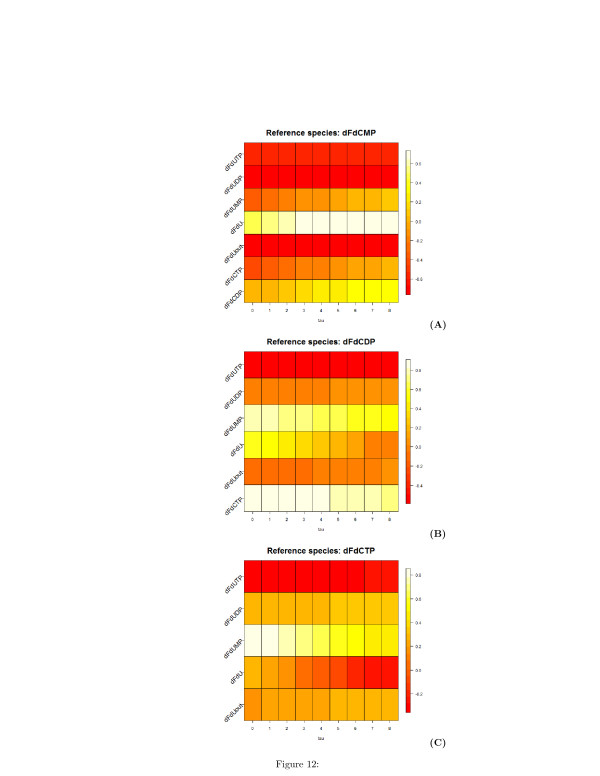
Results: The method of network inference presented in this paper is inspired by the theory of time-lagged correlation inference with regard to the deduction of the interaction network, and on a maximum likelihood approach with regard to the estimation of the kinetic parameters of the network. Both network inference and parameter estimation have been designed specifically to identify systems of biotransformations, at the biochemical level, from noisy time-resolved experimental data. We use our inference method to deduce the metabolic pathway of the gemcitabine. The inputs to our inference algorithm are the experimental time series of the concentration of gemcitabine and its metabolites. The output is the set of reactions of the metabolic network of the gemcitabine.
Conclusions: Time-lagged correlation based inference pairs up to a probabilistic model of parameter inference from metabolites time series allows the identification of the microscopic pharmacokinetics and pharmacodynamics of a drug with a minimal a priori knowledge. In fact, the inference model presented in this paper is completely unsupervised. It takes as input the time series of the concetrations of the parent drug and its metabolites. The method, applied to the case study of the gemcitabine pharmacokinetics, shows good accuracy and sensitivity.
Figures
Similar articles
-
An integrative network inference approach to predict mechanisms of cancer chemoresistance.Integr Biol (Camb). 2013 Mar;5(3):458-73. doi: 10.1039/c2ib20205k. Integr Biol (Camb). 2013. PMID: 23340828
-
MICRAT: a novel algorithm for inferring gene regulatory networks using time series gene expression data.BMC Syst Biol. 2018 Dec 14;12(Suppl 7):115. doi: 10.1186/s12918-018-0635-1. BMC Syst Biol. 2018. PMID: 30547796 Free PMC article.
-
Parameter inference for discretely observed stochastic kinetic models using stochastic gradient descent.BMC Syst Biol. 2010 Jul 21;4:99. doi: 10.1186/1752-0509-4-99. BMC Syst Biol. 2010. PMID: 20663171 Free PMC article.
-
Biological network inference for drug discovery.Drug Discov Today. 2013 Mar;18(5-6):256-64. doi: 10.1016/j.drudis.2012.11.001. Epub 2012 Nov 10. Drug Discov Today. 2013. PMID: 23147668 Review.
-
Methods of biological network inference for reverse engineering cancer chemoresistance mechanisms.Drug Discov Today. 2014 Feb;19(2):151-63. doi: 10.1016/j.drudis.2013.10.026. Epub 2013 Nov 5. Drug Discov Today. 2014. PMID: 24211413 Review.
Cited by
-
Reverse engineering cellular networks with information theoretic methods.Cells. 2013 May 10;2(2):306-29. doi: 10.3390/cells2020306. Cells. 2013. PMID: 24709703 Free PMC article.
-
Metabolic network discovery by top-down and bottom-up approaches and paths for reconciliation.Front Bioeng Biotechnol. 2014 Dec 3;2:62. doi: 10.3389/fbioe.2014.00062. eCollection 2014. Front Bioeng Biotechnol. 2014. PMID: 25520953 Free PMC article. Review.
-
MIDER: network inference with mutual information distance and entropy reduction.PLoS One. 2014 May 7;9(5):e96732. doi: 10.1371/journal.pone.0096732. eCollection 2014. PLoS One. 2014. PMID: 24806471 Free PMC article.
References
-
- Kramer MA, Eden UT, Cash SS, Kolaczyk ED. Network inference with confidence from multivariate time series. Phys Rev E. 2009;79:442–446. - PubMed
-
- Ross J, Schreiber I, Vlad MO. Determination of Complex Reaction Mechanisms: Analysis of Chemical, Biological, and Genetic Networks. Oxford University Press Inc., New York USA; 2006. - PubMed
MeSH terms
Substances
LinkOut - more resources
Full Text Sources
