

Mechanisms underlying azimuth selectivity in the auditory cortex of the pallid bat
- PMID: 22641192
- PMCID: PMC3413633
- DOI: 10.1016/j.heares.2012.05.008
Mechanisms underlying azimuth selectivity in the auditory cortex of the pallid bat
Abstract
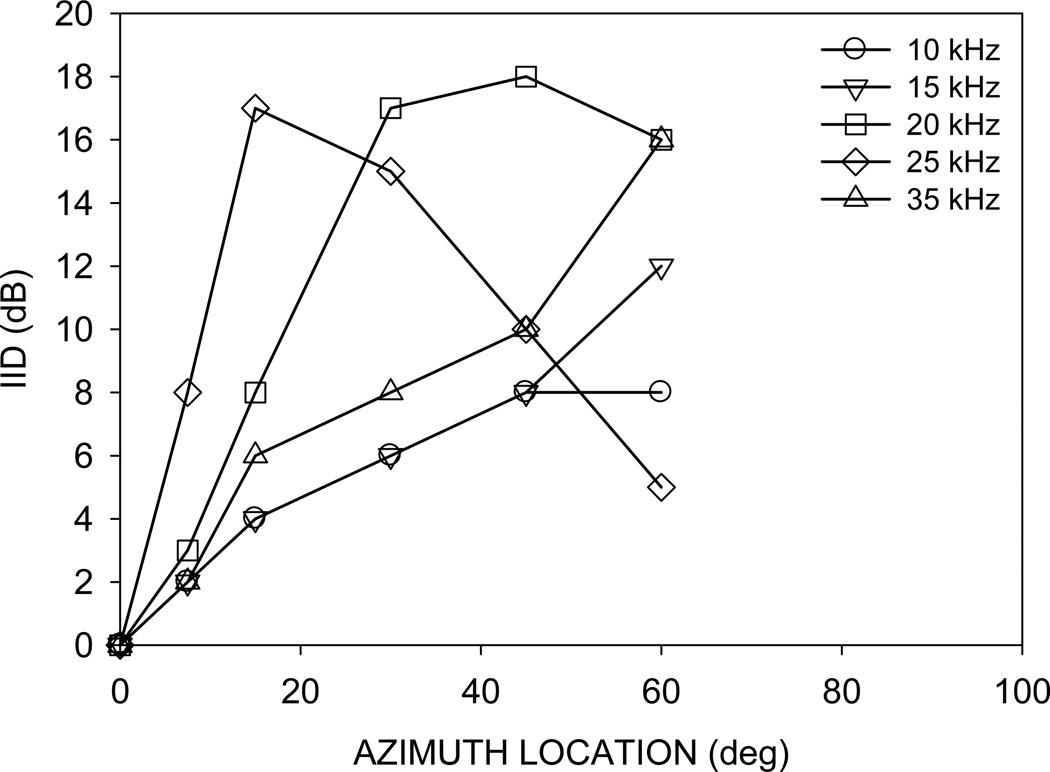
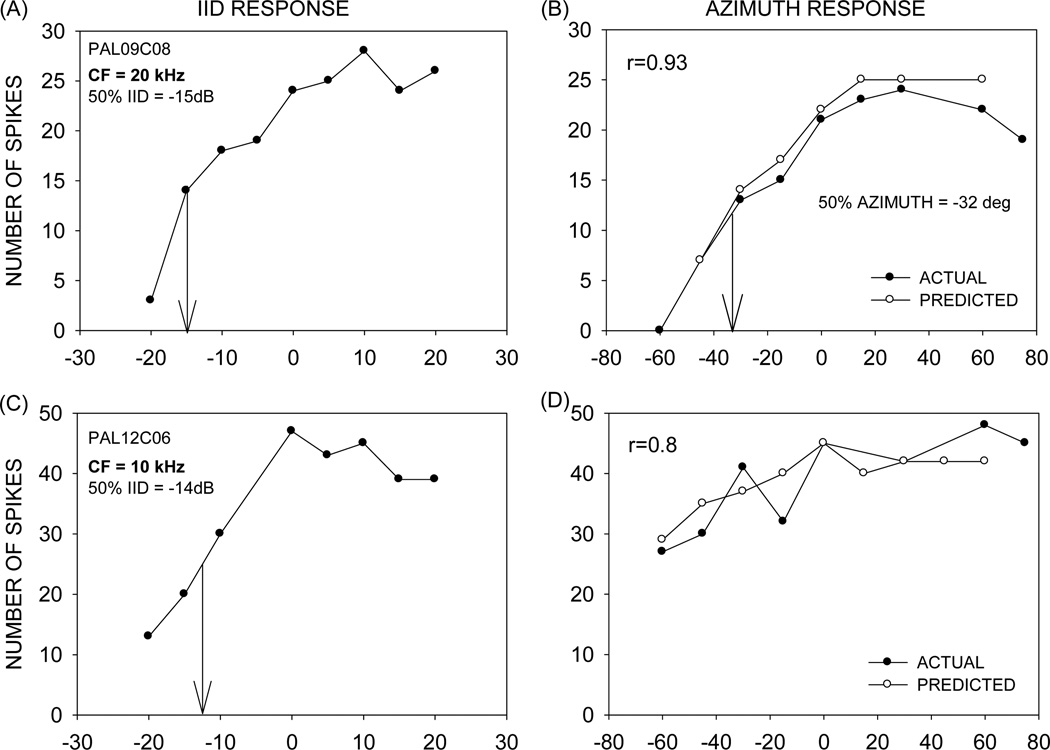
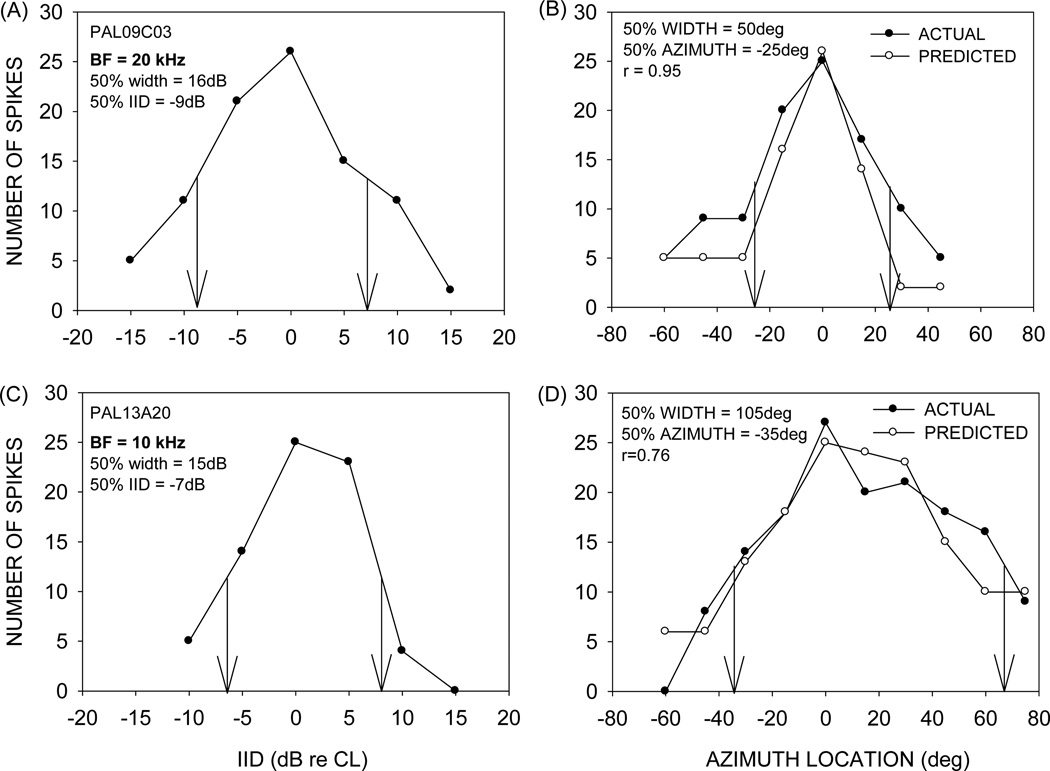
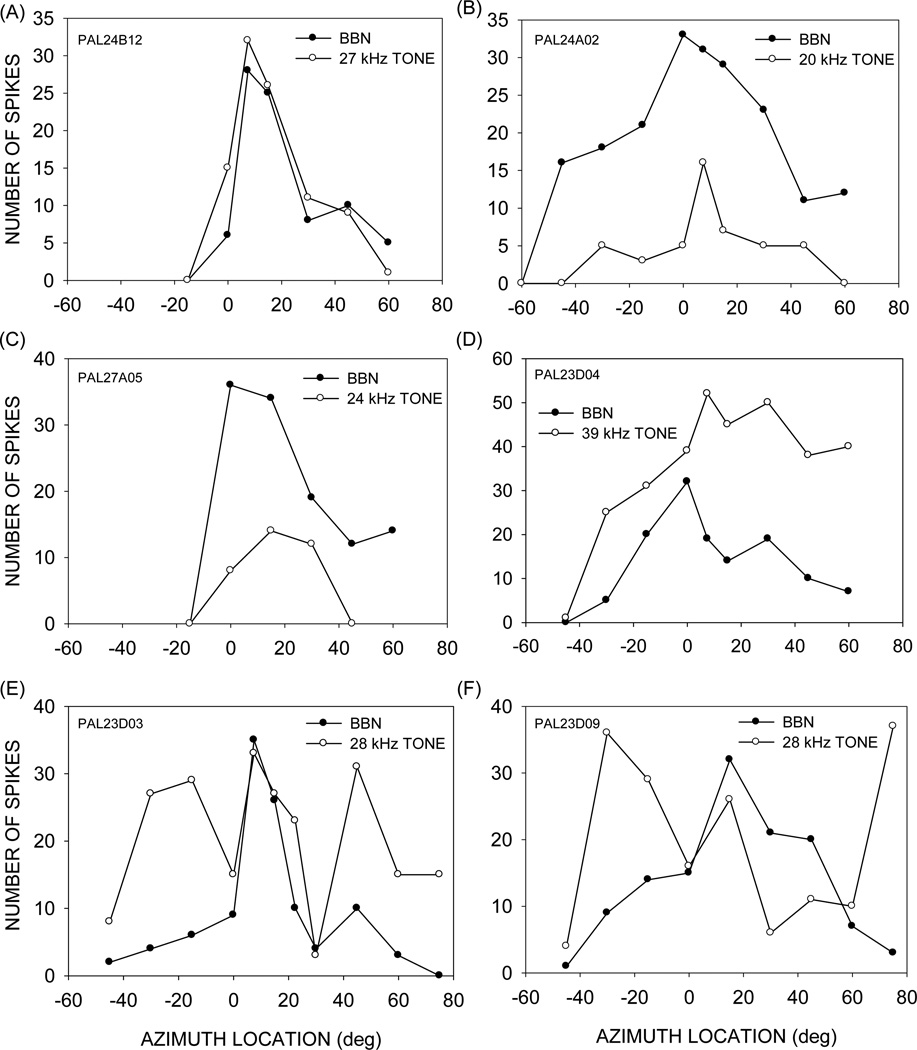
This study focused on mechanisms underlying azimuth selectivity in the primary auditory cortex (A1) of pallid bats. The pallid bat listens to prey-generated noise (5-35 kHz) to localize and hunt terrestrial prey. The region of A1 tuned between 5 and 35 kHz consists of two clusters of neurons distinguished by interaural intensity difference (IID) selectivity: binaurally inhibited (EI) and peaked. The first aim of this study was to use sequential dichotic/free-field stimulation to test the hypothesis that IID is the primary cue underlying azimuth selectivity in neurons tuned in the prey-generated noise frequency band. IID selectivity and ear directionality at the neuron's characteristic frequency (CF) were used to predict azimuth selectivity functions. The predicted azimuth selectivity was compared with the actual azimuth selectivity from the same neurons. Prediction accuracy was similarly high for EI neurons and peaked neurons with low CF, whereas predictions were increasingly inaccurate with increasing CF among the peaked neurons. The second aim of this study was to compare azimuth selectivity obtained with noise and CF tones to determine the extent to which stimulus bandwidth influences azimuth selectivity in neurons with different binaural properties. The azimuth selectivity functions were similar for the two stimuli in the majority of EI neurons. A greater percentage of peaked neurons showed differences in their azimuth selectivity for noise and tones. This included neurons with multiple peaks when tested with tones and a single peak when tested with noise. Taken together, data from the two aims suggest that azimuth tuning of EI neurons is primarily dictated by IID sensitivity at CF. Peaked neurons, particularly those with high CF, may integrate IID sensitivity across frequency to generate azimuth selectivity for broadband sound. The data are consistent with those found in cat and ferret A1 in that binaurally facilitated neurons depend to a greater extent (compared to EI neurons) on spectral integration of binaural properties to generate azimuth selectivity for broadband stimuli.
Copyright © 2012 Elsevier B.V. All rights reserved.
Figures


Similar articles
-
Functional organization of the pallid bat auditory cortex: emphasis on binaural organization.J Neurophysiol. 2002 Jan;87(1):72-86. doi: 10.1152/jn.00226.2001. J Neurophysiol. 2002. PMID: 11784731
-
Functional segregation of monaural and binaural selectivity in the pallid bat auditory cortex.Hear Res. 2016 Jul;337:35-45. doi: 10.1016/j.heares.2016.05.005. Epub 2016 May 24. Hear Res. 2016. PMID: 27233917
-
GABA shapes a systematic map of binaural sensitivity in the auditory cortex.J Neurophysiol. 2010 Jul;104(1):517-28. doi: 10.1152/jn.00294.2010. Epub 2010 May 19. J Neurophysiol. 2010. PMID: 20484524 Free PMC article.
-
Adaptations for Substrate Gleaning in Bats: The Pallid Bat as a Case Study.Brain Behav Evol. 2018;91(2):97-108. doi: 10.1159/000488873. Epub 2018 Jun 6. Brain Behav Evol. 2018. PMID: 29874652 Review.
-
Experience-dependent development of vocalization selectivity in the auditory cortex.J Acoust Soc Am. 2010 Sep;128(3):1446-51. doi: 10.1121/1.3377057. J Acoust Soc Am. 2010. PMID: 20815478 Free PMC article. Review.
Cited by
-
Development of echolocation calls and neural selectivity for echolocation calls in the pallid bat.Dev Neurobiol. 2015 Oct;75(10):1125-39. doi: 10.1002/dneu.22226. Epub 2014 Aug 28. Dev Neurobiol. 2015. PMID: 25142131 Free PMC article.
-
Magnetoencephalographic study on forward suppression by ipsilateral, contralateral, and binaural maskers.PLoS One. 2013 Jun 6;8(6):e66225. doi: 10.1371/journal.pone.0066225. Print 2013. PLoS One. 2013. PMID: 23762482 Free PMC article.
-
Mechanisms of Sound Localization in Two Functionally Distinct Regions of the Auditory Cortex.J Neurosci. 2015 Dec 9;35(49):16105-15. doi: 10.1523/JNEUROSCI.2563-15.2015. J Neurosci. 2015. PMID: 26658863 Free PMC article.
-
Representation of three-dimensional space in the auditory cortex of the echolocating bat P. discolor.PLoS One. 2017 Aug 16;12(8):e0182461. doi: 10.1371/journal.pone.0182461. eCollection 2017. PLoS One. 2017. PMID: 28813464 Free PMC article.
-
Parvalbumin and calbindin expression in parallel thalamocortical pathways in a gleaning bat, Antrozous pallidus.J Comp Neurol. 2014 Jul 1;522(10):2431-45. doi: 10.1002/cne.23541. J Comp Neurol. 2014. PMID: 24435957 Free PMC article.
References
-
- Aitkin LM, Martin RL. The representation of stimulus azimuth by high best-frequency azimuth-selective neurons in the central nucleus of the inferior colliculus of the cat. J Neurophysiol. 1987;57:1185–1200. - PubMed
-
- Barber JR, Razak KA, Fuzessery ZM. Can two streams of auditory information be processed simultaneously? Evidence from the gleaning bat Antrozous pallidus. J Comp Physiol A. 2003;189:843–855. - PubMed
-
- Bell GP. Behavioral and ecological aspects of gleaning by the desert insectivorous bat, Antrozous pallidus (Chiroptera: Vespertilionidae) Behav Ecol Sociobiol. 1982;10:217–223.
-
- Brainard MS, Knudsen EI, Esterly SD. Neural derivation of sound source location: resolution of spatial ambiguities in binaural cues. J Acoust Soc Am. 1992;91:1015–1027. - PubMed
-
- Brown CH, Beecher MD, Moody DB, Stebbins WC. Localization of noise bands by Old World monkeys. J Acoust Soc Am. 1980;68:127–132. - PubMed
Publication types
MeSH terms
Grants and funding
LinkOut - more resources
Full Text Sources
Miscellaneous
