

Exome sequencing and the genetic basis of complex traits
- PMID: 22641211
- PMCID: PMC3727622
- DOI: 10.1038/ng.2303
Exome sequencing and the genetic basis of complex traits
Abstract
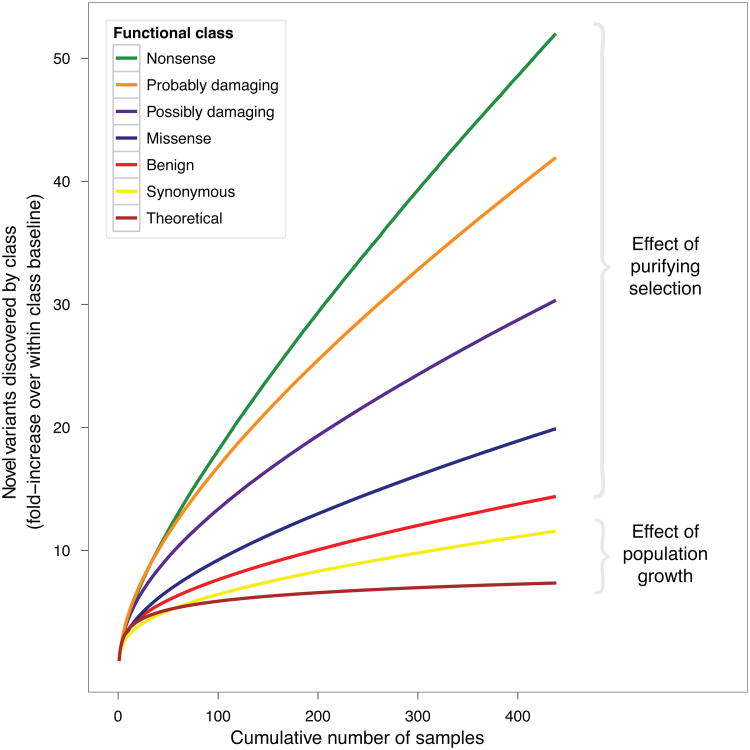
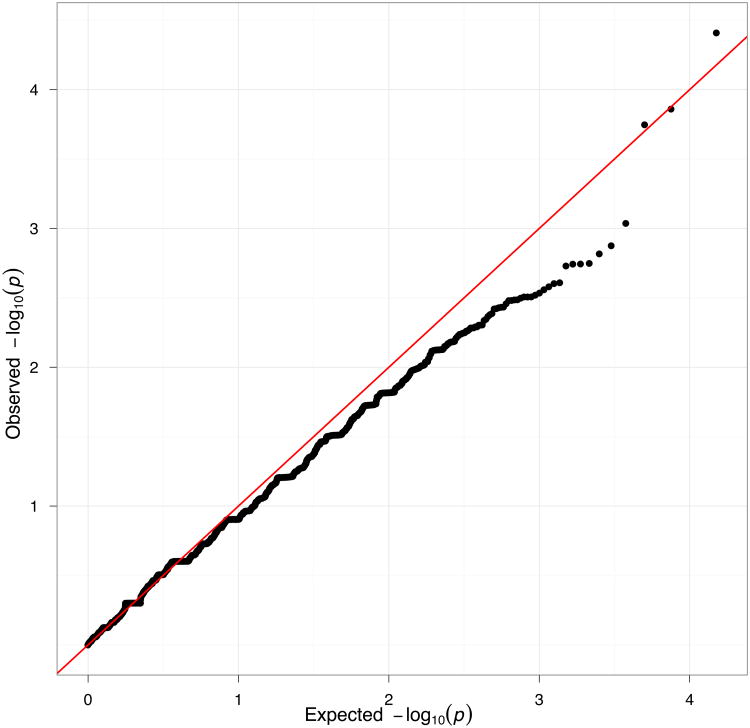
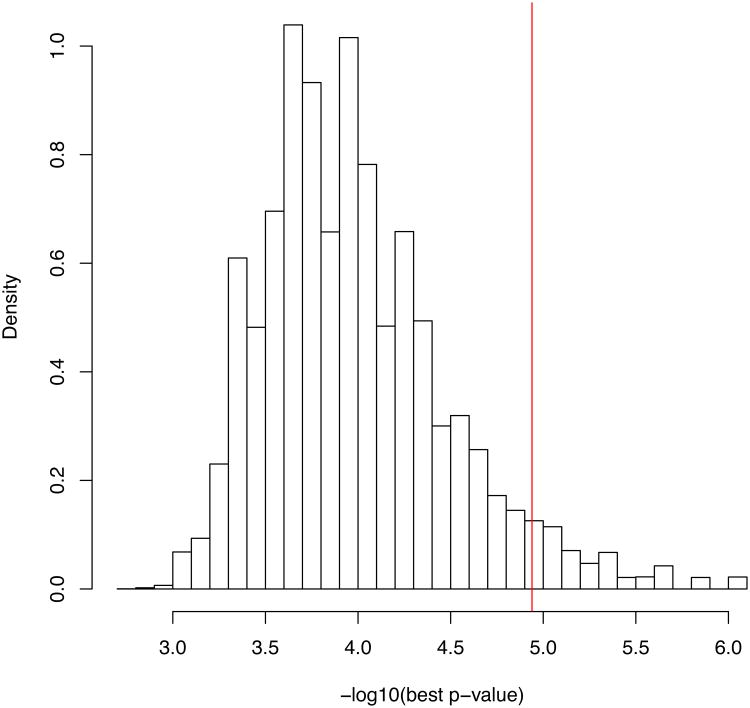
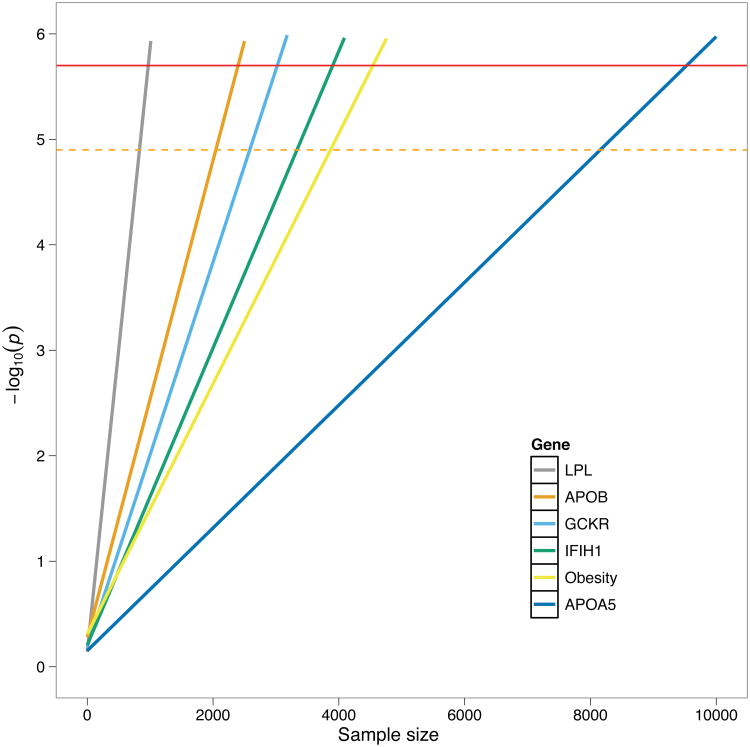
Exome sequencing is emerging as a popular approach to study the effect of rare coding variants on complex phenotypes. The promise of exome sequencing is grounded in theoretical population genetics and in empirical successes of candidate gene sequencing studies. Many projects aimed at common diseases are underway, and their results are eagerly anticipated. In this Perspective, using exome sequencing data from 438 individuals, we discuss several aspects of exome sequencing studies that we view as particularly important. We review processing and quality control of raw sequence data, evaluate the statistical properties of exome sequencing studies, discuss rare variant burden tests to detect association to phenotypes, and demonstrate the importance of accounting for population stratification in the analysis of rare variants. We conclude that enthusiasm for exome sequencing studies of complex traits should be combined with the caution that thousands of samples may be required to reach sufficient statistical power.
Conflict of interest statement
Figures
References
-
- Fuller CW, et al. The challenges of sequencing by synthesis. Nature Biotechnology. 2009;27:1013–1023. - PubMed
-
- Rusk N, Kiermer V. Primer: Sequencing—the next generation. Nature Methods. 2008;5:15. - PubMed
-
- Metzker ML. Sequencing technologies the next generation. Nature Reviews Genetics. 2009;11:31–46. - PubMed
-
- Shendure J, Ji H. Next-generation DNA sequencing. Nature Biotechnology. 2008;26:1135–1145. - PubMed
-
- Clarke J, et al. Continuous base identification for single-molecule nanopore DNA sequencing. Nature Nanotechnology. 2009;4:265–270. - PubMed
Publication types
MeSH terms
Grants and funding
- AI069452/AI/NIAID NIH HHS/United States
- UM1 AI069556/AI/NIAID NIH HHS/United States
- U01 AI069511/AI/NIAID NIH HHS/United States
- AI069450/AI/NIAID NIH HHS/United States
- U01 AI069477/AI/NIAID NIH HHS/United States
- U01 AI069502/AI/NIAID NIH HHS/United States
- U01 AI069513/AI/NIAID NIH HHS/United States
- AI68634/AI/NIAID NIH HHS/United States
- AI69467/AI/NIAID NIH HHS/United States
- UM1 AI069423/AI/NIAID NIH HHS/United States
- AI069415/AI/NIAID NIH HHS/United States
- U01 AI069474/AI/NIAID NIH HHS/United States
- U01 AI069434/AI/NIAID NIH HHS/United States
- AI069556/AI/NIAID NIH HHS/United States
- UM1 AI069501/AI/NIAID NIH HHS/United States
- UM1 AI069472/AI/NIAID NIH HHS/United States
- U01 AI069467/AI/NIAID NIH HHS/United States
- U01 AI069423/AI/NIAID NIH HHS/United States
- UM1 AI069513/AI/NIAID NIH HHS/United States
- UL1 TR000445/TR/NCATS NIH HHS/United States
- AI069465/AI/NIAID NIH HHS/United States
- R01 MH089208/MH/NIMH NIH HHS/United States
- R01 MH095034/MH/NIMH NIH HHS/United States
- AI069419/AI/NIAID NIH HHS/United States
- AI069511/AI/NIAID NIH HHS/United States
- AI46370/AI/NIAID NIH HHS/United States
- AI077505/AI/NIAID NIH HHS/United States
- U01 AI027661/AI/NIAID NIH HHS/United States
- UM1 AI069424/AI/NIAID NIH HHS/United States
- R01 AI077505/AI/NIAID NIH HHS/United States
- RC2 MH089905/MH/NIMH NIH HHS/United States
- U01 AI069465/AI/NIAID NIH HHS/United States
- UM1 AI069434/AI/NIAID NIH HHS/United States
- UM1 AI069432/AI/NIAID NIH HHS/United States
- AI069501/AI/NIAID NIH HHS/United States
- 5R01 MH084676/MH/NIMH NIH HHS/United States
- AI069532/AI/NIAID NIH HHS/United States
- AI069474/AI/NIAID NIH HHS/United States
- AI069434/AI/NIAID NIH HHS/United States
- UM1 AI069495/AI/NIAID NIH HHS/United States
- U01 AI069484/AI/NIAID NIH HHS/United States
- UM1 AI069471/AI/NIAID NIH HHS/United States
- U01 AI069556/AI/NIAID NIH HHS/United States
- CAPMC/ CIHR/Canada
- UM1 AI069428/AI/NIAID NIH HHS/United States
- AI069513/AI/NIAID NIH HHS/United States
- AI069502/AI/NIAID NIH HHS/United States
- TL1 RR024978/RR/NCRR NIH HHS/United States
- U01 AI069532/AI/NIAID NIH HHS/United States
- U01 AI034835/AI/NIAID NIH HHS/United States
- AI069423/AI/NIAID NIH HHS/United States
- AI30914/AI/NIAID NIH HHS/United States
- U01 AI069428/AI/NIAID NIH HHS/United States
- KL2 RR024977/RR/NCRR NIH HHS/United States
- UM1 AI069415/AI/NIAID NIH HHS/United States
- AI27661/AI/NIAID NIH HHS/United States
- UM1 AI069484/AI/NIAID NIH HHS/United States
- AI069428/AI/NIAID NIH HHS/United States
- AI34853/AI/NIAID NIH HHS/United States
- UM1 AI068634/AI/NIAID NIH HHS/United States
- U01 AI069501/AI/NIAID NIH HHS/United States
- AI069495/AI/NIAID NIH HHS/United States
- UM1 AI069477/AI/NIAID NIH HHS/United States
- U01 AI069432/AI/NIAID NIH HHS/United States
- AI069484/AI/NIAID NIH HHS/United States
- AI068636/AI/NIAID NIH HHS/United States
- U01 AI069450/AI/NIAID NIH HHS/United States
- RR024975/RR/NCRR NIH HHS/United States
- U01 AI046370/AI/NIAID NIH HHS/United States
- U01 AI068636/AI/NIAID NIH HHS/United States
- UM1 AI069474/AI/NIAID NIH HHS/United States
- U01 AI034853/AI/NIAID NIH HHS/United States
- R37 AI028568/AI/NIAID NIH HHS/United States
- 1R01MH089208-01/MH/NIMH NIH HHS/United States
- KL2 TR000446/TR/NCATS NIH HHS/United States
- UM1 AI069452/AI/NIAID NIH HHS/United States
- AI069424/AI/NIAID NIH HHS/United States
- RC2MH089905/MH/NIMH NIH HHS/United States
- U01 AI069415/AI/NIAID NIH HHS/United States
- U01 AI069495/AI/NIAID NIH HHS/United States
- UM1 AI069502/AI/NIAID NIH HHS/United States
- U01 AI025859/AI/NIAID NIH HHS/United States
- UM1 AI069450/AI/NIAID NIH HHS/United States
- TL1 TR000447/TR/NCATS NIH HHS/United States
- AI34835/AI/NIAID NIH HHS/United States
- UM1 AI069532/AI/NIAID NIH HHS/United States
- R01 MH084676/MH/NIMH NIH HHS/United States
- R01 HG005827/HG/NHGRI NIH HHS/United States
- U01 AI069424/AI/NIAID NIH HHS/United States
- UM1 AI069465/AI/NIAID NIH HHS/United States
- AL32782/PHS HHS/United States
- U01 AI032782/AI/NIAID NIH HHS/United States
- UL1 RR024975/RR/NCRR NIH HHS/United States
- AI069472/AI/NIAID NIH HHS/United States
- UM1 AI069419/AI/NIAID NIH HHS/United States
- AI28568/AI/NIAID NIH HHS/United States
- AI069432/AI/NIAID NIH HHS/United States
- R01 AI028568/AI/NIAID NIH HHS/United States
- T32 HL007604/HL/NHLBI NIH HHS/United States
- U01 AI069419/AI/NIAID NIH HHS/United States
- R01 AI030914/AI/NIAID NIH HHS/United States
- AI25859/AI/NIAID NIH HHS/United States
- UM1 AI069511/AI/NIAID NIH HHS/United States
- U01 AI069452/AI/NIAID NIH HHS/United States
- UM1 AI069467/AI/NIAID NIH HHS/United States
- AI38844/AI/NIAID NIH HHS/United States
- AI069477/AI/NIAID NIH HHS/United States
- U01 AI038844/AI/NIAID NIH HHS/United States
- AI069471/AI/NIAID NIH HHS/United States
- T32-HL07604-25/HL/NHLBI NIH HHS/United States
- U01 AI069471/AI/NIAID NIH HHS/United States
- U01 AI069472/AI/NIAID NIH HHS/United States
- U01 AI068634/AI/NIAID NIH HHS/United States
- UM1 AI068636/AI/NIAID NIH HHS/United States
LinkOut - more resources
Full Text Sources
Molecular Biology Databases
