. 2012 Jun 4;209(6):1201-17.
doi: 10.1084/jem.20112741. Epub 2012 May 28.

Programmed cell death 1 forms negative costimulatory microclusters that directly inhibit T cell receptor signaling by recruiting phosphatase SHP2

Affiliations

Programmed cell death 1 forms negative costimulatory microclusters that directly inhibit T cell receptor signaling by recruiting phosphatase SHP2

Tadashi Yokosuka et al. J Exp Med. .

Abstract

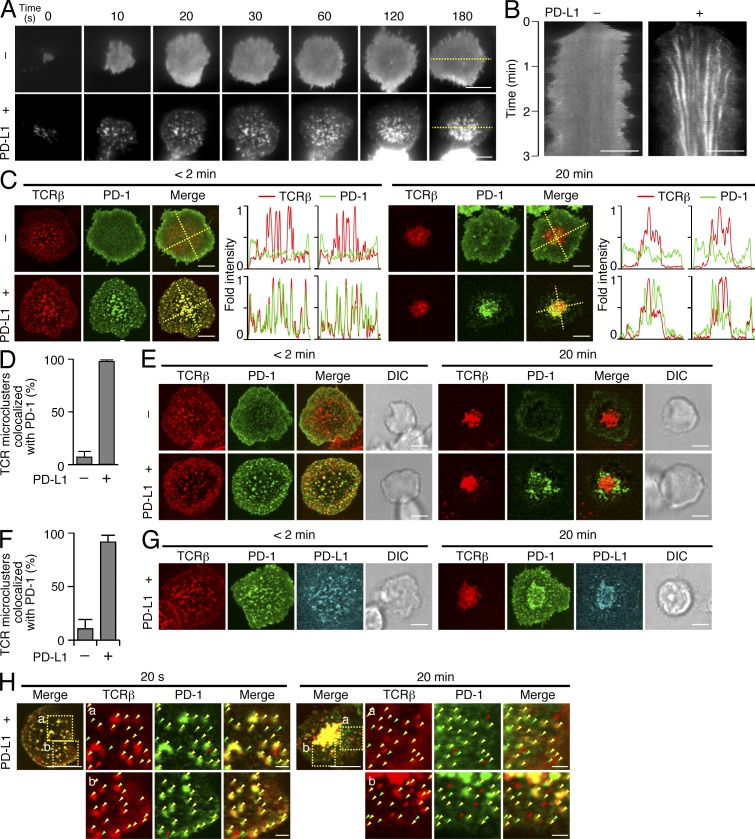
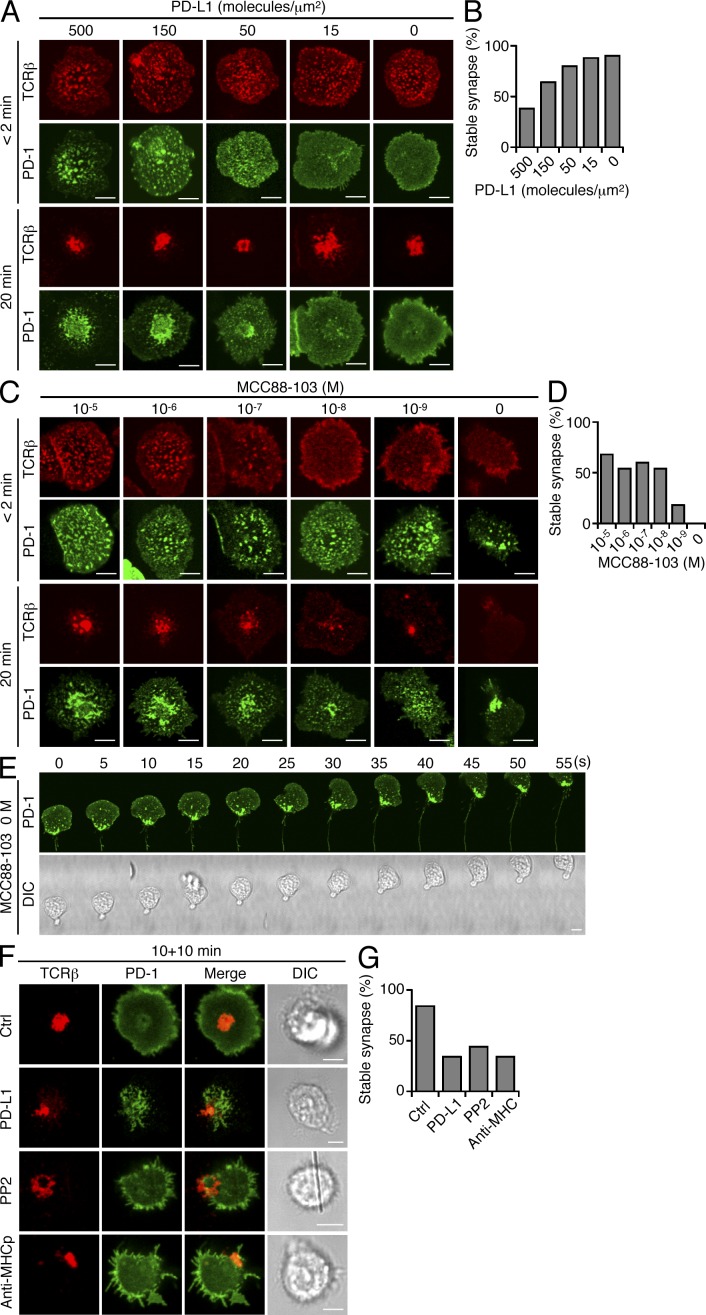
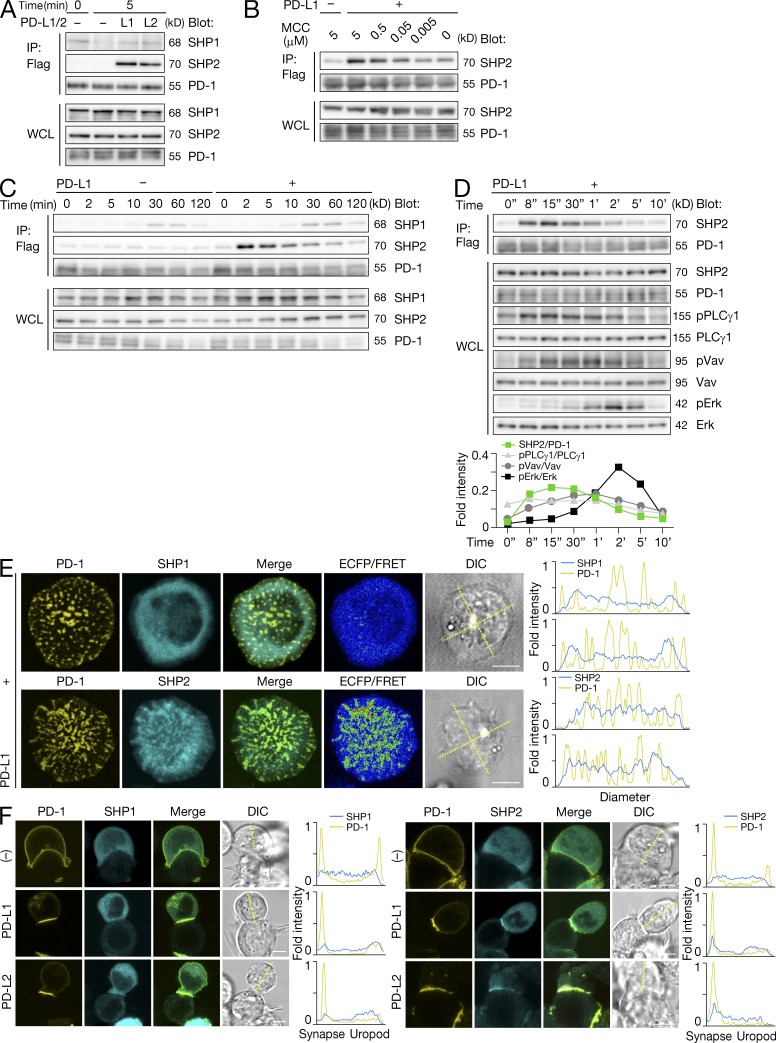
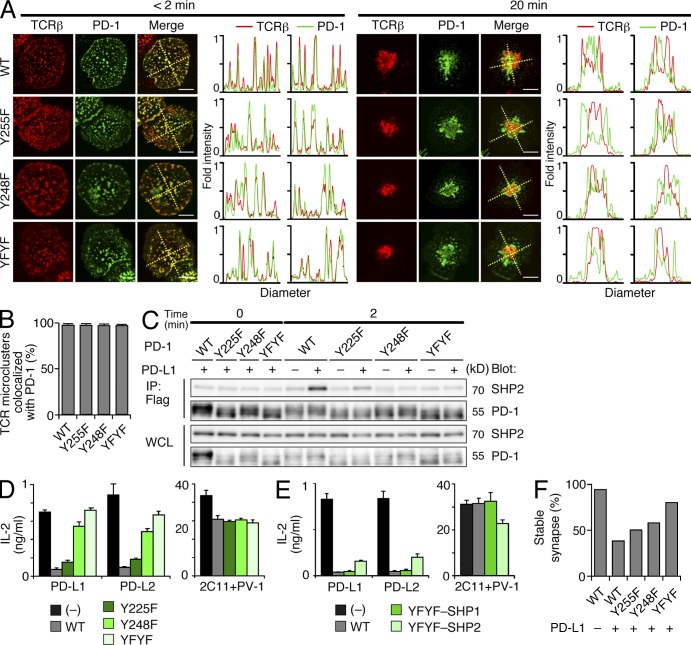
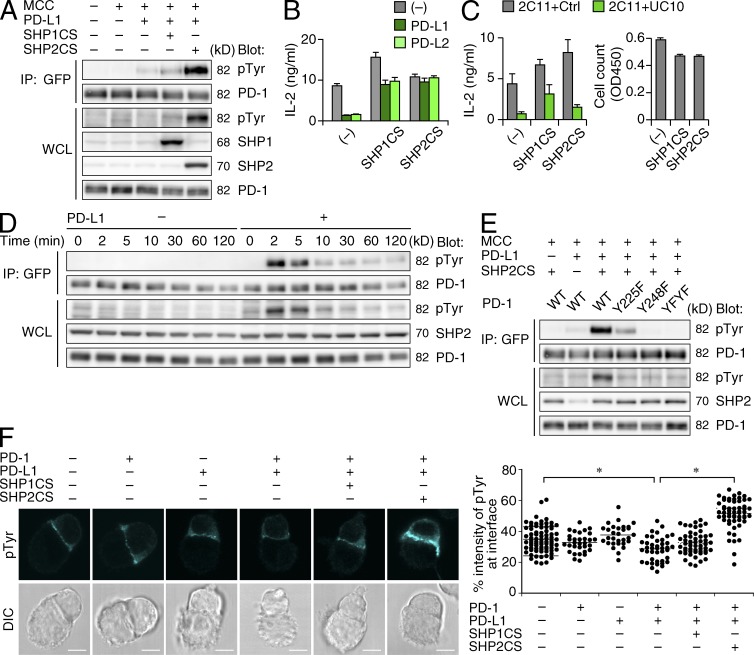
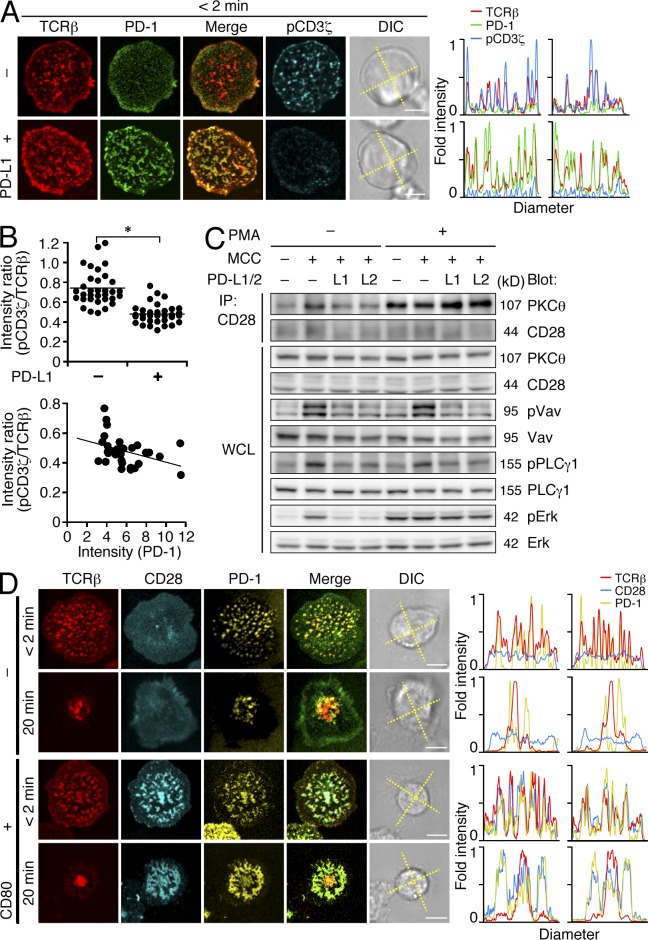
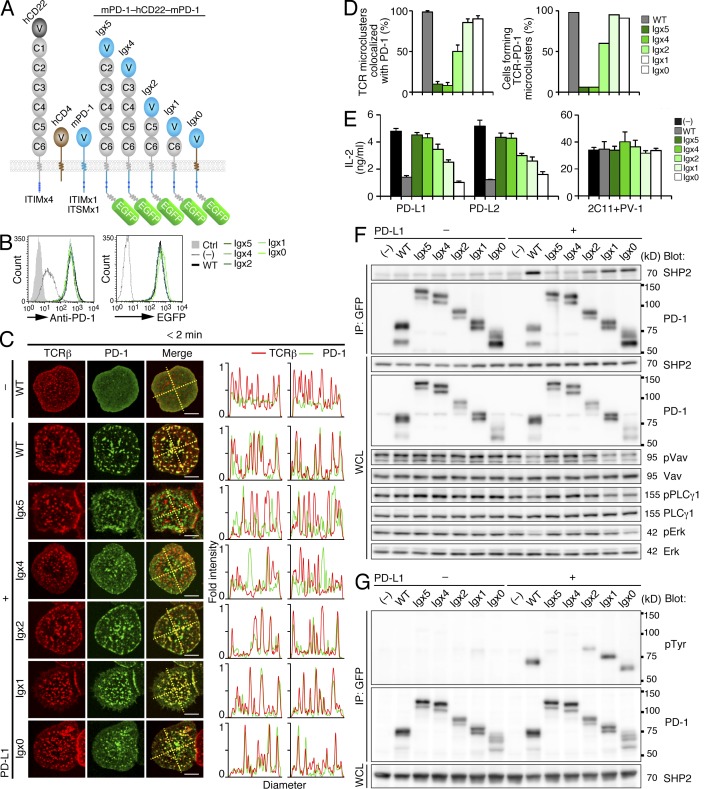
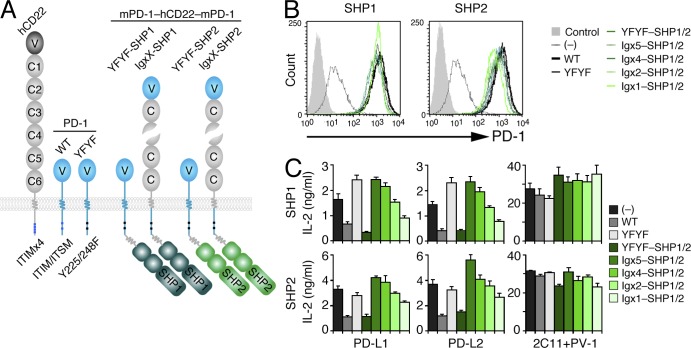
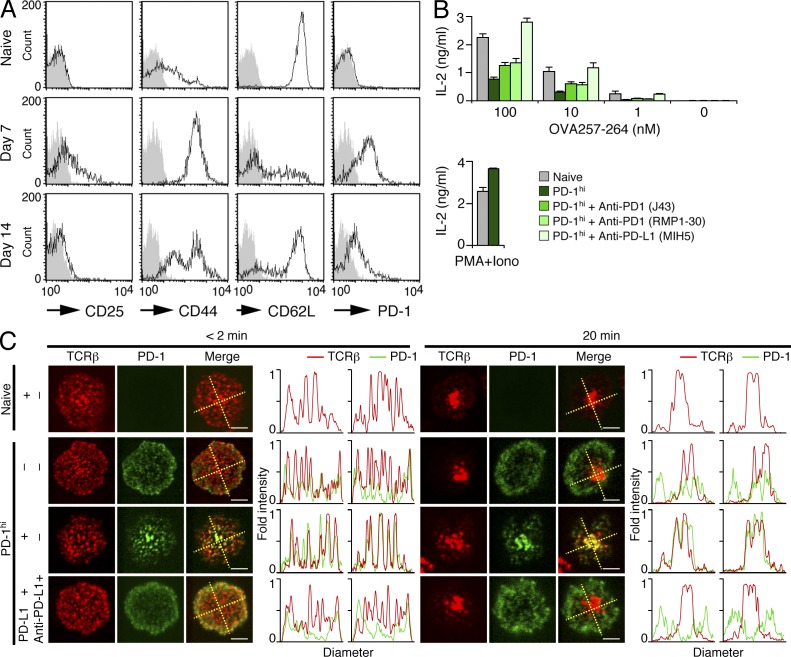
Programmed cell death 1 (PD-1) is a negative costimulatory receptor critical for the suppression of T cell activation in vitro and in vivo. Single cell imaging elucidated a molecular mechanism of PD-1-mediated suppression. PD-1 becomes clustered with T cell receptors (TCRs) upon binding to its ligand PD-L1 and is transiently associated with the phosphatase SHP2 (Src homology 2 domain-containing tyrosine phosphatase 2). These negative costimulatory microclusters induce the dephosphorylation of the proximal TCR signaling molecules. This results in the suppression of T cell activation and blockade of the TCR-induced stop signal. In addition to PD-1 clustering, PD-1-TCR colocalization within microclusters is required for efficient PD-1-mediated suppression. This inhibitory mechanism also functions in PD-1(hi) T cells generated in vivo and can be overridden by a neutralizing anti-PD-L1 antibody. Therefore, PD-1 microcluster formation is important for regulation of T cell activation.


Figures

Figure 1.
Figure 1.
PD-1 is translocated to TCR microclusters by PD-1–PD-L1 binding. (A) CD4+ T cells were purified from AND-Tg Pdcd1−/− Rag2−/− mice, stimulated with irradiated B10.BR whole splenocytes with 5 µM MCC88-103 peptide, and retrovirally transduced with PD-1-EGFP. The cells were plated onto an MCC88-103 (10 µM) prepulsed planar bilayer containing I-Ek–GPI (250/µm2), ICAM-1–GPI (100/µm2), and CD80-GPI (80/µm2) without (top) or with (bottom) PD-L1–GPI (150/µm2) and real-time imaged by TIRF microscopy (times are above images; Video 1). Bars, 5 µm. A representative of five independent experiments is shown. (B) Clustering and centripetal movement of PD-1 on the diagonal yellow line in A is presented as horizontal elements in kymographs. Bars, 5 µm. (C) The cells expressing PD-1–EGFP (green) in A were prestained with DyLight 649–labeled H57 Fab (red), plated onto a planar bilayer as in A, and real-time imaged by confocal microscopy at 2 (left) or 20 (right) min after contact. Histograms show fold fluorescent intensities of TCR-β (red) and PD-1 (green) on the two diagonal yellow lines in the merged images. Bars, 5 µm. A representative of three independent experiments is shown. (D) The graph shows the percentage of TCR microclusters colocalized by PD-1 at 2 min after contact in C (n = 5). Error bars represent SD. (E) AND-Tg Rag2−/− CD4+ T cells were stimulated for 2 d, directly stained with DyLight 649–labeled H57 Fab (red) and DyLight 488–labeled anti–mPD-1 (RMA1-30; green), and imaged as in A. Bars, 5 µm. A representative of four independent experiments is shown. (F) The graph shows the percentage of TCR microclusters colocalized by PD-1 at 2 min after contact in E (n = 10). Error bars represent SD. (G) The cells expressing PD-1–EGFP (green) in A were stained with DyLight 549–labeled H57 Fab (red) and imaged on an MCC88-103 prepulsed planar bilayer containing I-Ek–GPI, ICAM-1–GPI, CD80-GPI, and Cy5-labeled PD-L1–GPI (150/µm2, cyan). Bars, 5 µm. A representative of two independent experiments is shown. (H) Images of cells expressing WT PD-1-EGFP in C at 20 s (left) or 20 min (right) after contact. The yellow squares (a and b) in the left panels are magnified in the right three panels. Yellow arrowheads, a TCR–PD-1 microcluster; red arrowheads, a TCR microcluster not colocalized by PD-1; green arrowheads, a PD-1 microcluster not colocalized by TCR. Bars, 5 µm. A representative of two independent experiments is shown.
Figure 2.
Figure 2.
PD-1–PD-L1 binding blocks stable synapse formation. (A) AND-Tg Pdcd1−/− Rag2−/− CD4+ T cells expressing PD-1–EGFP were stained with DyLight 649–labeled H57 Fab. The cells were plated onto an MCC88-103 prepulsed planar bilayer containing I-Ek–, ICAM-1–, CD80-, and PD-1–GPI at the indicated densities, and real-time imaged by confocal microscopy at 2 (top tow rows) or 20 (bottom tow rows) min after contact. Bars, 5 µm. A representative of two independent experiments is shown. (B) The graph shows the percentage of cells in A forming a stable synapse at 20 min after contact (n = 50). (C) The cells in A were plated onto a planar bilayer containing I-Ek–, ICAM-1–, CD80-, and PD-L1–GPI prepulsed MCC88-103 at the indicated concentrations, and imaged by confocal microscopy at 2 (top tow rows) or 20 (bottom tow rows) min after contact. A representative of two independent experiments is shown. Bars, 5 µm. (D) The graph shows the percentage of cells in D forming a stable synapse at 20 min after contact (n = 50). (E) The cells in C (right column) were real-time imaged by confocal microscopy every 5 s at 10 min after contact. Bar, 5 µm. (F) The cells in A were plated onto an MCC88-103–prepulsed planar bilayer containing I-Ek–, ICAM-1–, and CD80- (row 1, 3, and 4) plus PD-L1–GPI (row 2). At 10 min after contact, the cells were further incubated with control antibodies (50 µg/ml, row 1), the Src kinase inhibitor PP2 (10 µM, row3), or anti-MHCp (14–4-4 and D4, 50 µg/ml each, row 4) for 10 min and imaged. Bars, 5 µm. A representative of two independent experiments is shown. (G) The graph shows the percentage of cells in F forming a stable synapse at 20 min after contact (n = 50).
Figure 3.
Figure 3.
SHP2, not SHP1, is transiently recruited to PD-1 microclusters. (A) AND-TCR T cell hybridomas expressing PD-1-Flag were stimulated by 5 µM MCC88-103 prepulsed DC-1 cells not expressing (−) or expressing PD-L1 (L1) or PD-L2 (L2) for 0 or 5 min. Cell lysate immunoprecipitated by anti-Flag or WCLs were blotted for SHP1, SHP2, or PD-1. A representative of five independent experiments is shown. (B) The cells in A were stimulated by nonexpressing or PD-L1–expressing DC-1 cells prepulsed with MCC88-103 at the indicated concentrations for 2 min. The cells were lysed, immunoprecipitated and blotted as in A. A representative of two independent experiments is shown. (C) The cells in A were stimulated with 5 µM MCC88-103 prepulsed DC-1 cells not expressing (−) or expressing PD-L1 (+) for the indicated times. The cells were lysed, immunoprecipitated, and blotted as in A. A representative of four independent experiments is shown. (D) The PD-1–SHP2 association was analyzed as in C at much earlier time points indicated above. WCLs were blotted for SHP2, PD-1, phospho-PLCγ1, PLCγ1, phospho-Vav1, Vav1, phospho-Erk1/2, or Erk1/2. The graph shows fold intensities of SHP2 to PD-1 or phosphorylated PLCγ1, Vav1, or Erk to nonphosphorylated at each time point. A representative of two independent experiments is shown. (E) AND-TCR T cell hybridomas expressing PD-1–YPet (yellow) and ECFP-SHP1 (top) or -SHP2 (bottom, cyan) were plated onto an MCC88-103 prepulsed planar bilayer containing I-Ek–, ICAM-1–, CD80-, and PD-1–GPI and real-time imaged by confocal microscopy within 2 min after contact. FRET efficiency values presented as a pseudo-color scale. Histograms show fold fluorescent intensities of PD-1 (yellow) and SHP1 or SHP2 (cyan) on the two diagonal yellow lines in a DIC image. Bars, 5 µm. A representative of two independent experiments is shown. (F) AND-TCR T cell hybridomas expressing PD-1-YPet (yellow) and CFP for energy transfer CyPet-SHP1 (left, cyan) or -SHP2 (right, cyan) were conjugated with DC-1 cells not expressing (top) or expressing PD-L1 (middle) or PD-L2 (bottom) and real-time imaged by confocal microscopy at 2 min after contact. Histograms show fold fluorescent intensities of PD-1 (yellow) and SHP1 or SHP2 (cyan) on the diagonal yellow line in a DIC image. Bars, 5 µm. A representative of two independent experiments is shown.
Figure 4.
Figure 4.
The tyrosine motifs in PD-1 are required for PD-1–mediated T cell suppression, not for PD-1 clustering. (A) AND-Tg Pdcd1−/− Rag2−/− CD4+ T cells were reconstituted with WT (top) or Y225F (row 2), Y248F (row 3), or Y225/248F (YFYF, bottom) mutant PD-1–EGFP (green), and were prestained with DyLight 649–labeled H57 Fab (red). The cells were plated onto an MCC88-103 prepulsed planar bilayer containing I-Ek–, ICAM-1–, CD80-, and PD-1–GPI and real-time imaged by confocal microscopy at 2 (left) or 20 (right) min after contact. Histograms show fold fluorescent intensities of TCR-β (red) and PD-1 (green) on the two diagonal yellow lines in the merged images. Bars, 5 µm. A representative of three independent experiments is shown. (B) The graph shows the percentage of TCR microclusters colocalized by WT or mutant PD-1 at 2 min after contact in A (n = 5). Error bars represent SD. (C) AND-TCR T cell hybridomas expressing WT or Y225F, Y248F, or YFYF mutant PD-1–Flag were stimulated with 5 µM MCC88-103 prepulsed DC-1 cells not expressing or expressing PD-L1 for 2 min. Cell lysate immunoprecipitated by anti-Flag or WCLs were blotted for SHP2 or PD-1. A representative of three independent experiments is shown. (D) Not transduced or PD-1–transduced AND-TCR T cell hybridomas in C were stimulated with an equal number of DC-1 cells expressing PD-L1 or PD-L2 with 0.3 µM MCC88-103 for 16 h. Immobilized anti-CD3ε (2C11, 10 µg/ml) and anti-CD28 (PV-1, 2 µg/ml) were used for control stimulation. Concentration of IL-2 was measured by ELISA. A representative of two independent experiments is shown. Error bars represent SD. (E) SHP1 or SHP2 were directly attached to the cytoplasmic tail of the YFYF mutant PD-1 and transduced into AND-TCR T cell hybridomas. The inhibitory function of the PD-1 YFYF-SHP1/SHP2 chimeras was analyzed as in D. A representative of three independent experiments is shown. Error bars represent SD. (F) The graph shows the percentage of cells in A forming a stable synapse at 20 min after contact (n = 50). Error bars represent SD.
Figure 5.
Figure 5.
PD-1 phosphorylation is predominantly regulated by the phosphatase activity of SHP2. (A) AND-TCR T cell hybridomas expressing PD-1–EGFP not transduced or transduced with phosphatase-dead SHP1 (SHP1CS) or SHP2 (SHP2CS) were stimulated with unpulsed or 5 µM MCC88-103 prepulsed DC-1 cells not expressing or expressing PD-L1 for 2 min. The cells were lysed, immunoprecipitated with anti-GFP, and blotted for phosphor-tyrosine (4G10) or PD-1. The bottom four rows show WCL blotted with 4G10, anti-SHP1, SHP2, or PD-1. A representative of three independent experiments is shown. (B) The cells in A were stimulated with DC-1 cells not expressing or expressing PD-L1 or PD-L2 with 0.3 µM MCC88-103 for 16 h. Concentration of IL-2 was measured by ELISA. A representative of two independent experiments is shown. Error bars represent SD. (C) AND-TCR T cell hybridomas expressing CTLA-4 were further transduced with SHP1CS or SHP2CS. The cells were stimulated by immobilized anti-CD3ε (2C11, 10 µg/ml) and control IgG or anti-CTLA-4 (UC10, 10 µg/ml) for 16 h. Concentration of IL-2 was measured by ELISA. The cell number initially prepared was measured by a Cell Counting kit. A representative of two independent experiments is shown. Error bars represent SD. (D) AND-TCR T cell hybridomas expressing both PD-1-EGFP and SHP2CS were stimulated with 5 µM MCC88-103 prepulsed DC-1 cells not expressing or expressing PD-L1 for the indicated times. The cells were lysed, immunoprecipitated, and blotted as in A. A representative of three independent experiments is shown. (E) AND-TCR T cell hybridomas expressing SHP2CS and WT or mutant PD-1-EGFP were stimulated with 5 µM MCC88-103 prepulsed DC-1 cells not expressing or expressing PD-L1 for 2 min. The cells were lysed and blotted as in A. A representative of three independent experiments is shown. (F) The cells in A were conjugated with 5 µM MCC88-103 prepulsed DC-1 cells not expressing or expressing PD-L1. At 2 min after contact, the cells were fixed, stained with 4G10, and imaged by confocal microscopy. Bars, 5 µm. The right graph shows the percent intensity of phosphotyrosine at the T cell–DC-1 interface against that of the entire T cell area. A representative of two independent experiments is shown. *, P < 0.001 with Student’s t test. Horizontal bars represent the mean of the percent intensity of phosphotyrosine at the interface.
Figure 6.
Figure 6.
PD-1–PD-L1 binding attenuates phosphorylation of TCR downstream molecules and CD28–PKC-θ association. (A) AND-TCR T cell hybridomas expressing PD-1-EGFP (green) were stained with DyLight 549–labeled H57 Fab (red), plated onto an MCC88-103 prepulsed planar bilayer containing I-Ek–, ICAM-1–, and CD80- (top) plus PD-L1–GPI (bottom), fixed at 2 min after contact, stained with Alexa Fluor 647–labeled anti–phospho-CD3ζ (cyan), and imaged by confocal microscopy. Histograms show fold fluorescent intensities of TCR-β (red), PD-1 (green), and phosho-CD3ζ (cyan) on the diagonal yellow lines in a DIC image. Bars, 5 µm. A representative of two independent experiments is shown. (B) The point graphs show pCD3ζ/TCR-β fluorescent intensity ratio at the T cell–bilayer interface in the absence or presence of PD-L1–GPI (left, n = 33) and the inverse correlation between PD-1 intensity and pCD3ζ/TCR-β ratio at the interface in the presence of PD-L1–GPI (right, y = 0.578 − 0.0173 x, R = 0.37294) in A. *, P < 0.001 with Student’s t test. Horizontal bars represent the mean of the intensity ratio. (C) AND-TCR T cell hybridomas expressing PD-1 and PKC-θ–EYFP were stimulated with unpulsed or MCC88-103 prepulsed DC-1 cells expressing PD-L1 or PD-L2 in the absence or presence of 50 ng/ml PMA. The cells were lysed, immunoprecipitated with anti-CD28, and blotted for PKC-θ or CD28. WCLs were blotted for PKC-θ, CD28, phospho-Vav1, Vav1, phospho-PLCγ1, PLCγ1, phospho-Erk1/2, or Erk1/2. A representative of two independent experiments is shown. (D) AND-Tg Rag2−/− CD4+ T cells were transduced with CD28-CyPet (cyan) and PD-1-YPet (yellow), stained with DyLight 649–labeled H57 Fab (red), plated onto an MCC88-103 prepulsed planar bilayer containing I-Ek–, ICAM-1–, and PD-L1–GPI (top two rows) plus CD80-GPI (bottom two rows), and real-time imaged by confocal microscopy at 2 or 20 min after contact. Histograms show fold fluorescent intensities of TCR-β (red), CD28 (cyan), and PD-1 (yellow) on the diagonal yellow lines in the DIC images. Bars, 5 µm. A representative of four independent experiments is shown.
Figure 7.
Figure 7.
Colocalization of PD-1 and TCRs at microclusters is required for PD-1–mediated T cell suppression. (A) A diagram of the EGFP-tagged mPD-1–hCD22–mPD-1 or mPD-1–hCD4–mPD-1 chimeras. The murine PD-1 IgV domain was attached to the second to sixth (Igx5), third to sixth (Igx4), fifth and sixth (Igx2), or sixth (Igx1) IgC domains of hCD22 or the stalk region of hCD4 (Igx0). The cytoplasmic tail of hCD22 or hCD4 is exchanged by that of murine PD-1 containing two tyrosine motifs, ITIM and ITSM, and further tagged with EGFP at the C terminus of mPD-1. (B) AND-TCR T cell hybridomas were not transduced (−) or transduced with EGFP-tagged WT PD-1 (WT) or elongated mPD-1 chimeras shown in A. The histograms show expression of cell surface PD-1 (top) or EGFP (bottom). (C) AND-Tg Pdcd1−/− Rag2−/− CD4+ T cells were reconstituted with the EGFP-tagged elongated PD-1, mPD-1–hCD22/CD4–mPD-1-EGFP constructs (Igx0–5; green) in A, stained with DyLight 649–labeled H57 Fab (red), plated onto an MCC88-103 prepulsed planar bilayer containing I-Ek–, ICAM-1–, and CD80- (top) plus PD–L1-GPI (bottom six rows), and real-time imaged by confocal microscopy at 2 min after contact. Histograms show fold fluorescent intensities of TCR-β (red) and PD-1 (green) on the two diagonal yellow lines in the merged images. Bars, 5 µm. A representative of two independent experiments is shown. (D) The left graph shows the percentage of TCR microclusters colocalized by WT or elongated PD-1 in C (n = 10). The right graph shows the percentage of cells forming >50% of TCR microclusters colocalized by PD-1 in C (n = 50). Error bars represent SD. (E) AND-TCR T cell hybridomas expressing the EGFP-tagged elongated PD-1 chimeras in B were stimulated with DC-1 cells expressing PD-L1 or PD-L2 with 0.3 µM OVA88-103 for 16 h. Immobilized anti-CD3ε (2C11) and anti-CD28 (PV-1) were used for control stimulation. Concentration of IL-2 was measured by ELISA. A representative of three independent experiments is shown. Error bars represent SD. (F) The cells in B were stimulated with MCC88-103 prepulsed DC-1 cells not expressing or expressing PD-L1 for 2 min. The cells were lysed, immunoprecipitated with anti-GFP, and blotted for SHP2 or PD-1. WCLs (bottom six rows) were blotted for PD-1, phospho-Vav1, Vav1, phospho-PLCγ1, PLCγ1, phospho-Erk1/2, or Erk1/2. A representative of three independent experiments is shown. (G) The cells in B were further transduced with SHP2CS and stimulated as in F. The cells were lysed, immunoprecipitated with anti-GFP (top two rows), and blotted with 4G10 (top) or anti-GFP (middle). WCLs (bottom) were blotted for SHP2. A representative of two independent experiments is shown.
Figure 8.
Figure 8.
Clustering of phosphatase outside TCRs microclusters is less effective for suppression of IL-2 production. (A) A diagram of the mPD-1–hCD22–mPD-1 YFYF–mSHP1 or –mSHP2 chimeras. The tyrosine substitution (Y225/148F) was inserted and EGFP was replaced by mSHP1 or mSHP2 in mPD-1–hCD22–mPD-1–EGFP chimeras as in Fig. 7 A. (B) AND-TCR T cell hybridomas were not transduced (−) or transduced with WT or YFYF mutant PD-1 or the YFYF mutant or the elongated PD-1 YFYF fused to SHP1 (YFYF, Igx5, Igx4, Igx2, or Igx1-SHP1) or SHP2 (YFYF, Igx5, Igx4, Igx2, or Igx1-SHP2) in A. The histograms show cell surface expression of the various PD-1 chimeras fused by SHP1 (left) or SHP2 (right). (C) The cells in B were stimulated with DC-1 cells expressing PD-L1 or PD-L2 with 0.3 µM MCC88-103 for 16 h. Immobilized 2C11 and PV-1 were used for control stimulation. Concentration of IL-2 was measured by ELISA. A representative of two independent experiments is shown. Error bars represent SD.
Figure 9.
Figure 9.
Anti–PD-L1 blocks PD-1 microcluster formation and anergic status in PD-1hi CD8+ T cells. (A) OT-I-Tg Rag2−/− mice were subcutaneously injected with 3 nmol OVA257-264 in 100 µl PBS everyday for 1 wk. Histograms show the cell surface expression of CD25, CD44, CD62L, and PD-1 on splenic CD8+ T cells from OT-I-Tg Rag2−/− mice before (top) or at 7 (middle) or 14 (bottom) d after first challenge. A representative of three independent experiments is shown. (B) Naive or OVA257-264–challenged (PD-1hi) OT-I-Tg CD8+ T cells were stimulated with irradiated C57/BL6 whole splenocytes for 15 h with the indicated concentrations of OVA257-264 in the absence or presence of anti-PD-1 (J43 or RMA1-30) or anti-PD-L1 (MIH5). 10 ng/ml PMA and 0.5 µM ionomycin were used for control stimulation. Concentration of IL-2 was measured by ELISA. A representative of three independent experiments is shown. Error bars represent SD. (C) Naive or OT-I-Tg PD-1hi CD8+ T cells in A were stained with DyLight 649–labeled H57 Fab (red) and DyLight 488–labeled anti–PD-1 (RMA1-30) (green), plated onto an OVA257-264 prepulsed planar bilayer containing H-2Kb–, ICAM-1–, and CD80- (row 2) plus PD-L1–GPI (rows 1, 3, and 4), and real-time imaged by confocal microscopy at 2 (left) or 20 (right) min after contact in the absence (top three rows) or presence (bottom) of anti–PD-L1 (MIH5). Histograms show fold fluorescent intensities of TCR-β (red) and PD-1 (green) on the diagonal yellow lines in the merged images. Bars, 5 µm. A representative of two independent experiments is shown.

Similar articles

Cited by

References

    1. Agata Y., Kawasaki A., Nishimura H., Ishida Y., Tsubata T., Yagita H., Honjo T. 1996. Expression of the PD-1 antigen on the surface of stimulated mouse T and B lymphocytes. Int. Immunol. 8:765–772 10.1093/intimm/8.5.765 - DOI - PubMed
    1. Barber D.L., Wherry E.J., Masopust D., Zhu B., Allison J.P., Sharpe A.H., Freeman G.J., Ahmed R. 2006. Restoring function in exhausted CD8 T cells during chronic viral infection. Nature. 439:682–687 10.1038/nature04444 - DOI - PubMed
    1. Braiman A., Barda-Saad M., Sommers C.L., Samelson L.E. 2006. Recruitment and activation of PLCgamma1 in T cells: a new insight into old domains. EMBO J. 25:774–784 10.1038/sj.emboj.7600978 - DOI - PMC - PubMed
    1. Bunnell S.C., Hong D.I., Kardon J.R., Yamazaki T., McGlade C.J., Barr V.A., Samelson L.E. 2002. T cell receptor ligation induces the formation of dynamically regulated signaling assemblies. J. Cell Biol. 158:1263–1275 10.1083/jcb.200203043 - DOI - PMC - PubMed
    1. Campi G., Varma R., Dustin M.L. 2005. Actin and agonist MHC–peptide complex–dependent T cell receptor microclusters as scaffolds for signaling. J. Exp. Med. 202:1031–1036 10.1084/jem.20051182 - DOI - PMC - PubMed

Publication types

MeSH terms