Electromechanical and elastic probing of bacteria in a cell culture medium
- PMID: 22641388
- PMCID: PMC3409894
- DOI: 10.1088/0957-4484/23/24/245705
Electromechanical and elastic probing of bacteria in a cell culture medium
Abstract
Rapid phenotype characterization and identification of cultured cells, which is needed for progress in tissue engineering and drug testing, requires an experimental technique that measures physical properties of cells with sub-micron resolution. Recently, band excitation piezoresponse force microscopy (BEPFM) has been proven useful for recognition and imaging of bacteria of different types in pure water. Here, the BEPFM method is performed for the first time on physiologically relevant electrolyte media, such as Dulbecco's phosphate-buffered saline (DPBS) and Dulbecco's modified Eagle's medium (DMEM). Distinct electromechanical responses for Micrococcus lysodeikticus (Gram-positive) and Pseudomonas fluorescens (Gram-negative) bacteria in DPBS are demonstrated. The results suggest that mechanical properties of the outer surface coating each bacterium, as well as the electrical double layer around them, are responsible for the BEPFM image formation mechanism in electrolyte media.
Figures


 ) and DPBS (
 ) and for PLL in DMEM (
 ) and DPBS (
 ). The zoomed inset shows a linear relationship for DPBS and DMEM.


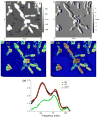
 ), and D-PF (
 ) was divided by the averaged spectrum for PLL (e), all from selected areas as indicated in

Similar articles
-
Germ cell differentiation of mouse embryonic stem cells can be influenced by the culture medium.Biotech Histochem. 2020 Apr;95(3):210-218. doi: 10.1080/10520295.2019.1665711. Epub 2019 Oct 16. Biotech Histochem. 2020. PMID: 31617423
-
Protective layer formation on magnesium in cell culture medium.Mater Sci Eng C Mater Biol Appl. 2016 Jun;63:341-51. doi: 10.1016/j.msec.2016.03.003. Epub 2016 Mar 3. Mater Sci Eng C Mater Biol Appl. 2016. PMID: 27040228
-
Differential staining of bacteria: gram stain.Curr Protoc Microbiol. 2009 Nov;Appendix 3:Appendix 3C. doi: 10.1002/9780471729259.mca03cs15. Curr Protoc Microbiol. 2009. PMID: 19885931
-
Effects of media composition and light exposure on the electrochemical current response during scanning electrochemical microscopy live cell imaging.Analyst. 2024 Nov 4;149(22):5555-5562. doi: 10.1039/d4an01075b. Analyst. 2024. PMID: 39449279
-
Microbial surfaces investigated using atomic force microscopy.Biotechnol Prog. 2004 Nov-Dec;20(6):1615-22. doi: 10.1021/bp049742c. Biotechnol Prog. 2004. PMID: 15575691 Review.
Cited by
-
Nanoforging Single Layer MoSe2 Through Defect Engineering with Focused Helium Ion Beams.Sci Rep. 2016 Aug 2;6:30481. doi: 10.1038/srep30481. Sci Rep. 2016. PMID: 27480346 Free PMC article.
-
Assessment of in vitro particle dosimetry models at the single cell and particle level by scanning electron microscopy.J Nanobiotechnology. 2018 Dec 7;16(1):100. doi: 10.1186/s12951-018-0426-2. J Nanobiotechnology. 2018. PMID: 30526603 Free PMC article.
-
Mechanical spectroscopy of materials using atomic force microscopy (AFM-MS).Mater Today (Kidlington). 2024 Nov;80:218-225. doi: 10.1016/j.mattod.2024.08.021. Epub 2024 Sep 13. Mater Today (Kidlington). 2024. PMID: 40453869
References
-
- Dokukin ME, Guz NV, Vasilyev S, Sokolov I. Atomic force microscopy to detect internal live processes in insects. Appl Phys Lett. 2010;96:043701.
-
- Minary-Jolandan M, Yu MF. Uncovering nanoscale electromechanical heterogeneity in the subfibrillar structure of collagen fibrils responsible for the piezoelectricity of bone. ACS Nano. 2009;3:1859–63. - PubMed
-
- Soman P, Siedlecki CA. Effects of protein solution composition on the time- dependent functional activity of fibrinogen on surfaces. Langmuir. 2011;27:10814–19. - PubMed
Publication types
MeSH terms
Substances
Grants and funding
LinkOut - more resources
Full Text Sources
Other Literature Sources
