

Review
doi: 10.1085/jgp.201110757.
Perspectives on: SGP symposium on mitochondrial physiology and medicine: the pathophysiology of LETM1
Affiliations
- PMID: 22641639
- PMCID: PMC3362517
- DOI: 10.1085/jgp.201110757
Item in Clipboard
Review
Perspectives on: SGP symposium on mitochondrial physiology and medicine: the pathophysiology of LETM1
J Gen Physiol.
2012 Jun.
No abstract available
Figures
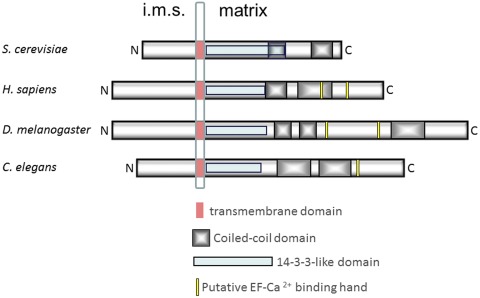
The LETM1 protein superfamily. Schematic representation of selected LETM1 family members aligned on the highly conserved transmembrane region. Specific domains are represented, and bar lengths are proportional to the length of the corresponding amino acid sequences. i.m.s., intermembrane space.
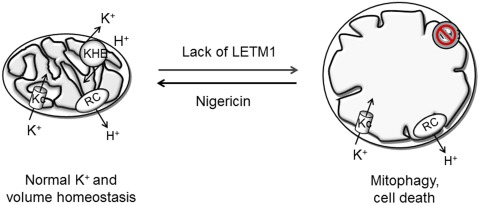
Mitochondrial K+ and volume homeostasis. RC, respiratory chain; KC, potassium channels; KHE, K+–H+ exchange. For further explanation, see text.
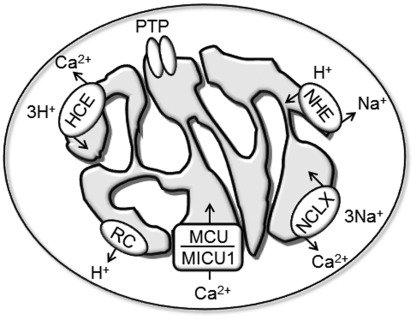
Pathways for Ca2+ transport in mammalian mitochondria. RC, respiratory chain; MCU, mitochondrial Ca2+ uniporter; MICU1, mitochondrial Ca2+ uptake 1; NCLX, Na+–Ca2+ exchanger; HCE, H+–Ca2+ exchanger; PTP, permeability transition pore. For explanation, see text.
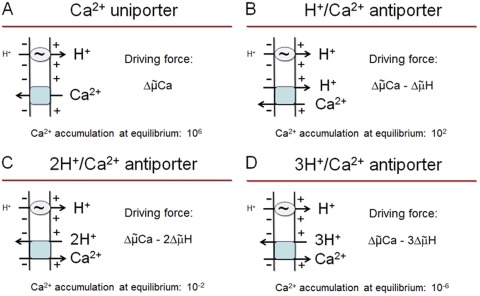
Predicted equilibrium Ca2+ accumulation depending on mode of Ca2+ transport in energized mitochondria. The scheme highlights the net direction of Ca2+ flux for transport via a Ca2+ uniporter (A), a H+–Ca2+ exchanger (B), a 2H+–Ca2+ exchanger (C), and a 3H+–Ca2+ exchanger (D) in respiring mitochondria. The predicted equilibrium Ca2+ accumulation was calculated as described in the Appendix and refers to the matrix/cytosol concentration ratio so that a negative figure means that Ca2+ is more concentrated in the cytosol. The squiggle denotes the redox-coupled H+ pumps. For further explanation, see text and Appendix.
References
-
- Altschuld R.A., Hohl C.M., Castillo L.C., Garleb A.A., Starling R.C., Brierley G.P. 1992. Cyclosporin inhibits mitochondrial calcium efflux in isolated adult rat ventricular cardiomyocytes. Am. J. Physiol. 262:H1699–H1704 - PubMed
-
- Bauerschmitt H., Mick D.U., Deckers M., Vollmer C., Funes S., Kehrein K., Ott M., Rehling P., Herrmann J.M. 2010. Ribosome-binding proteins Mdm38 and Mba1 display overlapping functions for regulation of mitochondrial translation. Mol. Biol. Cell. 21:1937–1944 10.1091/mbc.E10-02-0101 - DOI - PMC - PubMed
Publication types
MeSH terms
Substances
Grants and funding
LinkOut - more resources
Full Text Sources
