. 2012 Sep 15;125(Pt 18):4333-42.
doi: 10.1242/jcs.103648. Epub 2012 May 28.

Toxofilin upregulates the host cortical actin cytoskeleton dynamics, facilitating Toxoplasma invasion

Affiliations

Toxofilin upregulates the host cortical actin cytoskeleton dynamics, facilitating Toxoplasma invasion

Violaine Delorme-Walker et al. J Cell Sci. .

Abstract

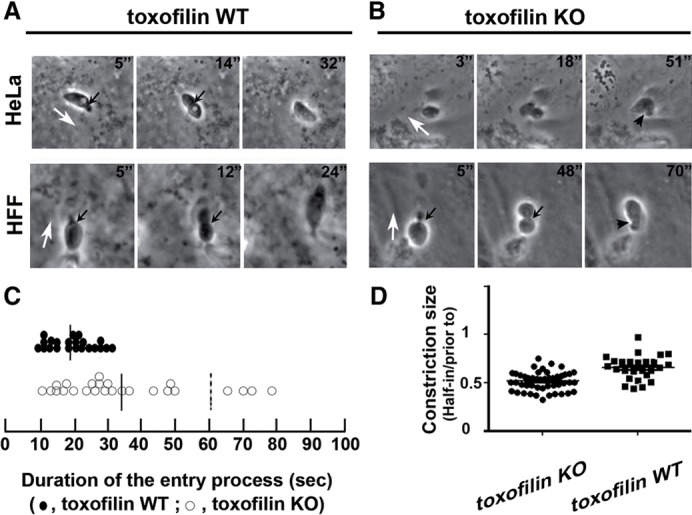
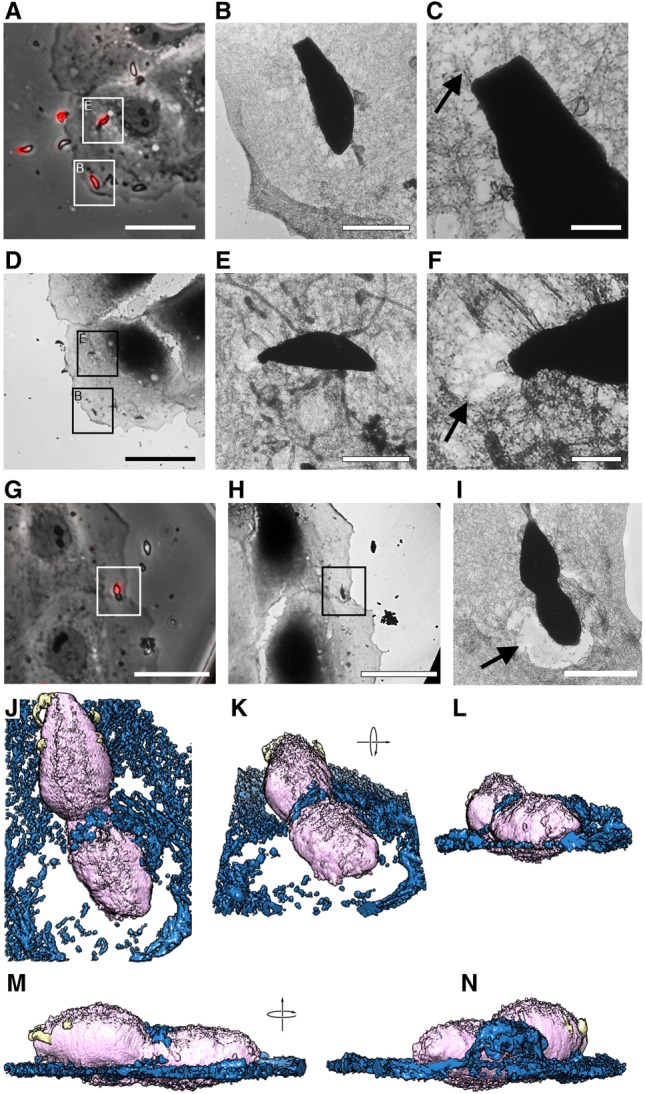
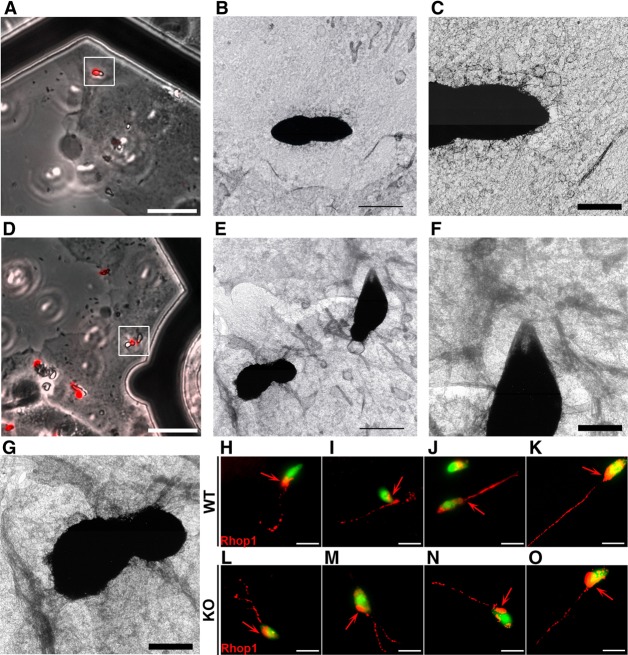
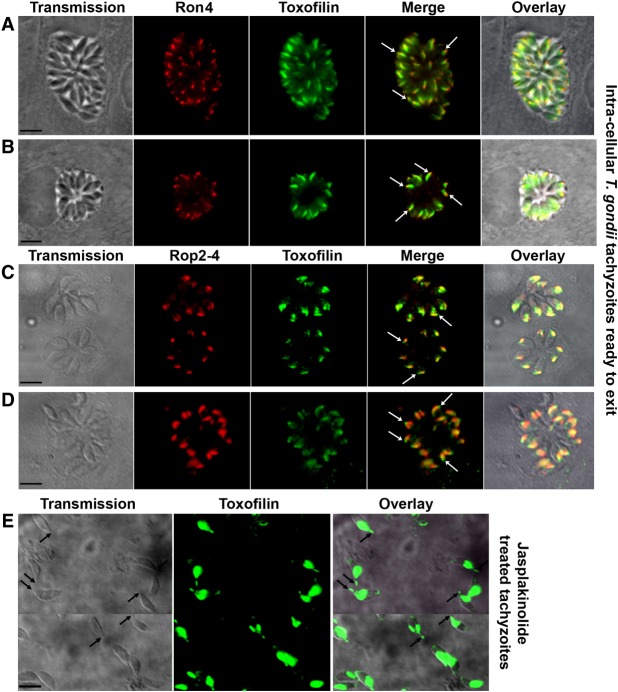
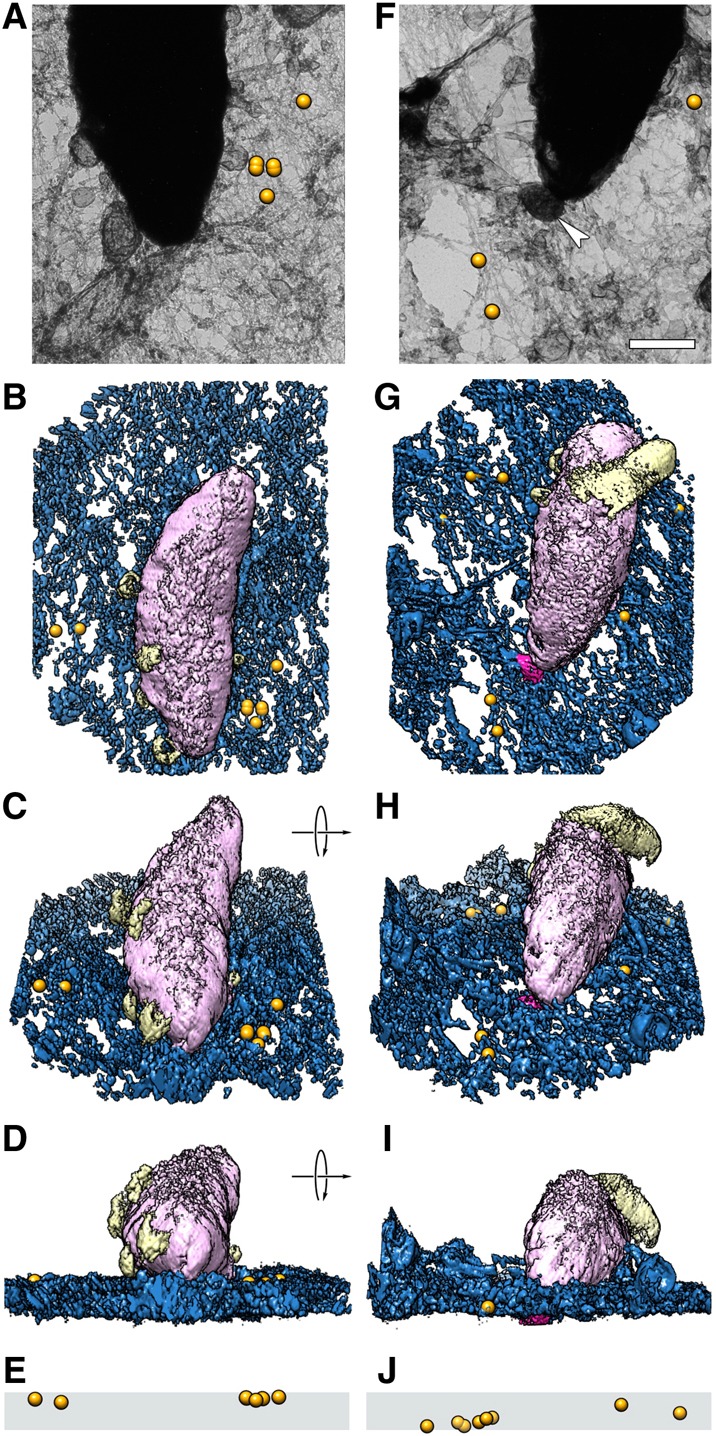
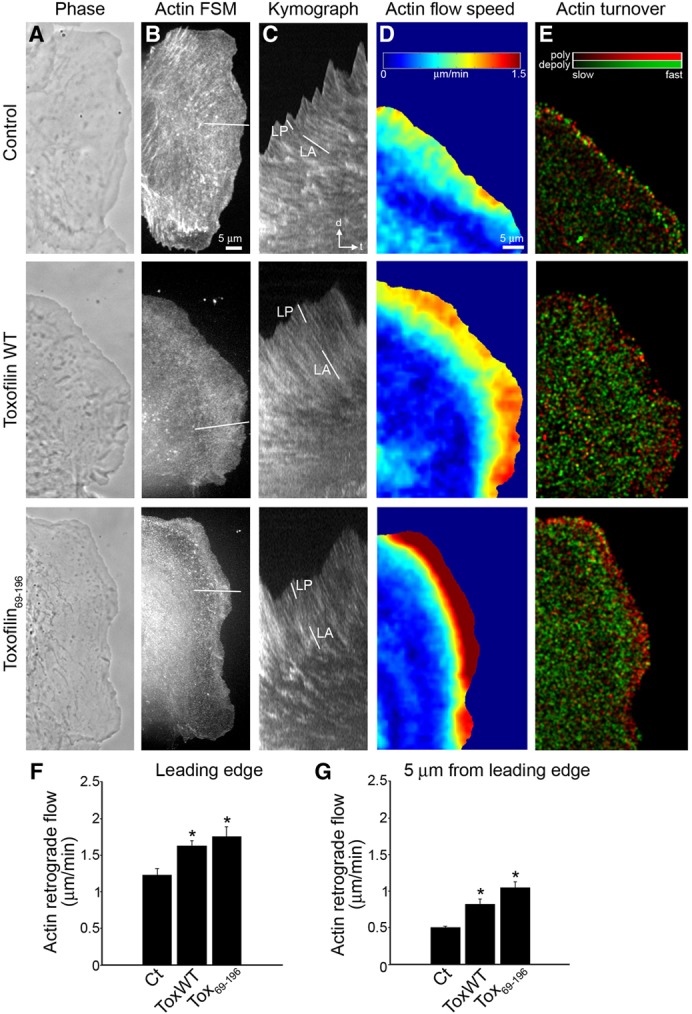
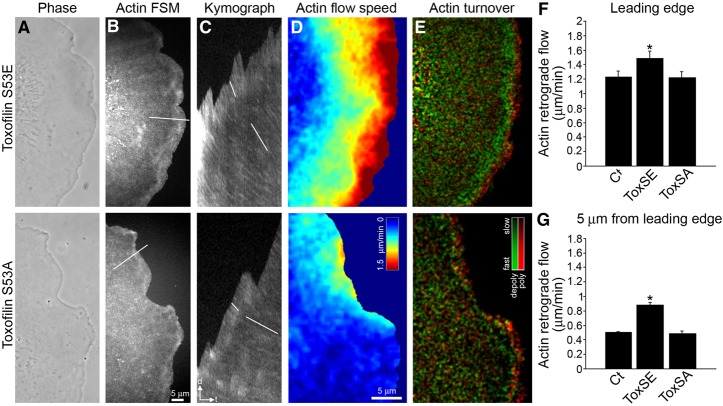
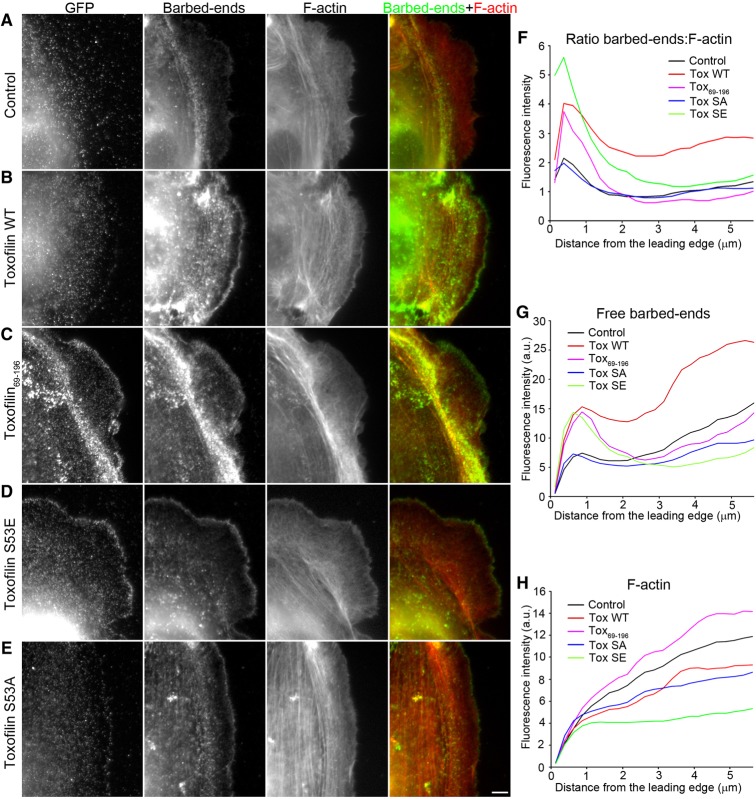
Toxoplasma gondii, a human pathogen and a model apicomplexan parasite, actively and rapidly invades host cells. To initiate invasion, the parasite induces the formation of a parasite-cell junction, and progressively propels itself through the junction, inside a newly formed vacuole that encloses the entering parasite. Little is known about how a parasite that is a few microns in diameter overcomes the host cell cortical actin barrier to achieve the remarkably rapid process of internalization (less than a few seconds). Using correlative light and electron microscopy in conjunction with electron tomography and three-dimensional image analysis we identified that toxofilin, an actin-binding protein, secreted by invading parasites correlates with localized sites of disassembly of the host cell actin meshwork. Moreover, quantitative fluorescence speckle microscopy of cells expressing toxofilin showed that toxofilin regulates actin filament disassembly and turnover. Furthermore, Toxoplasma tachyzoites lacking toxofilin, were found to be impaired in cortical actin disassembly and exhibited delayed invasion kinetics. We propose that toxofilin locally upregulates actin turnover thus increasing depolymerization events at the site of entry that in turn loosens the local host cell actin meshwork, facilitating parasite internalization and vacuole folding.


Figures

Fig. 1.
Fig. 1.
Toxofilin knockout (KO) tachyzoites display atypical invasive behaviors. (A,B) Time-lapse images of invasion events by (A) toxofilin WT and (B) toxofilin-KO tachyzoites in HeLa (upper lane) and HFF cells (lower lane). The forward movement into the cell is indicated with white arrows. Parasite constriction during the invasion process is indicated by black arrows (n = 40 and 49 cells for WT and KO parasites, respectively). (C) Graph representing the duration of the entry process in HeLa cells (n = 22 and 25 invasion events for WT and KO parasites respectively; P<0.05, Student's t-test). Black straight lines represent the average entry time for both populations, and the dashed black line indicates the average time for entry of atypical invasion by KO tachyzoites. (D) Graph representing the size of the constriction of WT (n = 30) and KO (n = 46) parasites (P<0.05, Student's t-test).
Fig. 2.
Fig. 2.
Tachyzoites are associated with sparse cortical actin network upon PtK1 cell entry. (A) Overlay of P30 fluorescence image (red) and a phase-contrast microscopy image of invading toxofilin WT parasites. Scale bar: 30 µm. (D) Transmission electron micrograph of the same field of view at the same magnification as shown in A. (B,E) High resolution electron micrographs of non-internalized tachyzoites identified by P30 fluorescence in A. Scale bars: 2 µm. (C,F) Enlarged image of the tachyzoites in B and E. Note the extent of cytoskeleton loosening (black arrow). Scale bars: 500 nm. (G) Overlay of P30 fluorescence image (red) and phase-contrast microscopy image. (H) Transmission electron micrograph of the same field of view at the same magnification as shown in G. Scale bars: 30 µm (G,H). (I) High resolution electron micrograph of the tachyzoite marked in G and H. Note the large area devoid of cytoskeleton at the apical (black arrow), non-fluorescing part of the tachyzoite. Scale bar: 2 µm; n = 19 invading tachyzoites. (J-N) Surface representation of the tomogram depicting the same tachyzoite (pink and yellow) shown in G-I. See also supplementary material Movie 1. The material associated with the host cell is shown in blue. The view in K is rotated by 60° around the indicated axis with respect to the view in G-J. The view in L is rotated by 90° with respect to the view in G-I and represents a view parallel to the plasma membrane of the host cell. (M,N) Two views rotated by 60° anti-clockwise and clockwise respectively, relative to the view shown in L, around the indicated axis. In I-K the lack of host actin cytoskeleton around the invading tachyzoite is apparent.
Fig. 3.
Fig. 3.
Toxofilin knockout (KO) tachyzoites are not associated with a sparse cortical actin network upon entry into PtK1 cells and they are able to secrete evacuoles. (A,D) Overlay of P30 fluorescence image (red) and a phase contrast microscopy image of invading toxofilin-KO parasites. Scale bars: 20 µm. (B,E) High resolution electron micrograph of invading tachyzoite identified by P30 fluorescence in A and D. Scale bars: 2 µm. (C,F,G) Enlarged images of the tachyzoites in A and D. Scale bars: 1 µm. Note the integrity of the host cell cytoskeleton surrounding the invading tachyzoite beyond the constriction (n = 8 invading tachyzoites). (H-O) Rhop1 fluorescent labeling of evacuoles (red) secreted by toxofilin WT (H-K) and KO (L-O) tachyzoites expressing GFP in HFF confluent cells. Red arrows point to the rhoptry. Scale bars: 5 µm.
Fig. 4.
Fig. 4.
Toxofilin localizes to the bulb and the neck of the rhoptry secretory vesicles. (A-D) Immunofluorescence of HFF cells infected with T. gondii tachyzoites for ∼24 h. Samples were stained for (A,B) the rhoptry neck protein Ron4 (red) and toxofilin (green), or (C,D) the Rhop2-4 proteins (red) and toxofilin (green). Arrows indicate the apical neck localization of toxofilin. (E) Jasplakinolide-treated tachyzoites. Arrows mark the presence of toxofilin in the membrane-enclosed apical projections. Scale bars: 10 µm.
Fig. 5.
Fig. 5.
Gold-labeled toxofilin localizes at the site of tachyzoite invasion. (A,F) Electron micrograph of non-internalized tachyzoites with gold labels (toxofilin) shown as orange spheres. Scale bar: 500 nm. A larger field of view is shown in supplementary material Fig. S3. White arrowhead in F indicates the apex of the entering parasite. (B-D,G-I) Surface representations of the tomograms of the same tachyzoites shown in a and f. See also supplementary material Movies 5 and 6. C and H are rotated 60° with respect to the corresponding view in A,B and F,G, respectively, around the indicated axis. D and I are rotated by 90°, representing a view parallel to the host cell plasma membrane. The tachyzoite is shown in pink and yellow, the host cell material (membrane and cytoskeleton) in blue. (E,J) Individual labels from the views in D and I, respectively, mapped onto the thickness of the host cell (symbolized as a gray box; n = 17 invading tachyzoites).
Fig. 6.
Fig. 6.
Toxofilin expression increases F-actin flow and treadmilling. (A,B) Phase-contrast (A) and FSM images of X-rhodamine actin (B) in motile PtK1 cells expressing GFP (control), GFP–toxofilin WT or GFP–toxofilin69-196. Scale bar: 5 µm. (C) Kymographs taken along the axis of F-actin flow (indicated by a line in B). The lines indicate the positions where the F-actin flow rates were measured in the lamellipodium (LP) and lamella (LA). Time bar (t), 2 min; scale bar (d), 2 µm. (D) qFSM kinematic maps of the speed of F-actin flow. Note the faster flow (red) in cells expressing toxofilin. Scale bar: 5 µm. (E) qFSM kinetic map of F-actin polymerization (red) and depolymerization (green) rates. Brightness indicates relative rate magnitude. (F,G) Average rates of F-actin retrograde flow in the lamellipodium (F) and the lamella (G) of cells expressing GFP (Ct), GFP–toxofilin WT (ToxWT), GFP–toxofilin69-196 (Tox69-196). Values are means ± s.e.m. Toxofilin expression significantly increased F-actin flow rates at the cell edge. *P<0.001 versus control cells, Student's t-test. n≥18 cells for each condition, with a minimum of 450 measurements per condition.
Fig. 7.
Fig. 7.
Phosphorylation of toxofilin on serine 53 regulates its activity on F-actin dynamics. (A,B) Phase-contrast (A) and FSM images of X-rhodamine actin (B) in motile PtK1 cells expressing GFP–toxofilin S53E or GFP–toxofilin S53A mutants. Scale bar: 5 µm. (C) Kymographs taken from lines oriented along the axis of F-actin flow (indicated in B). Lines in C indicate the positions where the F-actin flow rates were measured in the lamellipodium (upper) and lamella (lower). Time bar (t), 2 min; scale bar (d): 2 µm. (D) qFSM kinematic maps of the speed of F-actin flow. (E) qFSM kinetic map of F-actin polymerization (red) and depolymerization (green) rates. Brightness indicates relative rate magnitude. Scale bar: 5 µm. (F,G) Average rates of F-actin retrograde flow in the lamellipodium (F) and the lamella (G) of cells expressing GFP (Ct), GFP–toxofilin S53E (ToxSE) or GFP–toxofilin S53A (ToxSA). Values are means ± s.e.m. Phosphomimetic toxofilin mutant expression significantly increased F-actin flow rates and turnover at the cell edge. *P<0.001 versus control cells, Student's t-test. n≥18 cells for each condition, with a minimum of 450 measurements per condition.
Fig. 8.
Fig. 8.
Toxofilin increases the formation of polymerization-competent free barbed-ends. (A-E) Free barbed-end actin incorporation (green in merged image) and phalloidin staining (red in merged image) in PtK1 cells expressing GFP (A, noted control), GFP–toxofilin WT (B), GFP–toxofilin69-196 (C), GFP–toxofilin S53E (D) or GFP–toxofilin S53A (E). Scale bar: 5 µm. (F-H) Fluorescence intensity of (F) free barbed-ends actin incorporation relative to F-actin, (G) free barbed-end actin incorporation, and (H) F-actin in control (black), toxofilin WT (red), toxofilin69-196 (pink), toxofilin S53E (blue), toxofilin S53A (green), measured from the leading edge (0 µm) to the cell center (5 µm). The data shown are representative of one experiment and are the average from ≥9 cells for each condition. The experiment was repeated three times, with similar results.

References

    1. Alexander D. L., Mital J., Ward G. E., Bradley P., Boothroyd J. C. (2005). Identification of the moving junction complex of Toxoplasma gondii: a collaboration between distinct secretory organelles. PLoS Pathog. 1, e17 10.1371/journal.ppat.0010017 - DOI - PMC - PubMed
    1. Besteiro S., Michelin A., Poncet J., Dubremetz J. F., Lebrun M. (2009). Export of a Toxoplasma gondii rhoptry neck protein complex at the host cell membrane to form the moving junction during invasion. PLoS Pathog. 5, e1000309 10.1371/journal.ppat.1000309 - DOI - PMC - PubMed
    1. Bradley P. J., Sibley L. D. (2007). Rhoptries: an arsenal of secreted virulence factors. Curr. Opin. Microbiol. 10, 582–587 10.1016/j.mib.2007.09.013 - DOI - PMC - PubMed
    1. Bradley P. J., Ward C., Cheng S. J., Alexander D. L., Coller S., Coombs G. H., Dunn J. D., Ferguson D. J., Sanderson S. J., Wastling J. M., et al. (2005). Proteomic analysis of rhoptry organelles reveals many novel constituents for host-parasite interactions in Toxoplasma gondii. J. Biol. Chem. 280, 34245–34258 10.1074/jbc.M504158200 - DOI - PubMed
    1. Danuser G., Waterman–Storer C. M. (2006). Quantitative fluorescent speckle microscopy of cytoskeleton dynamics. Annu. Rev. Biophys. Biomol. Struct. 35, 361–387 10.1146/annurev.biophys.35.040405.102114 - DOI - PubMed

Publication types

MeSH terms