. 2012 Aug 15;590(16):3987-4010.
doi: 10.1113/jphysiol.2012.227462. Epub 2012 May 28.

Interneuron-mediated inhibition synchronizes neuronal activity during slow oscillation

Affiliations

Interneuron-mediated inhibition synchronizes neuronal activity during slow oscillation

Jen-Yung Chen et al. J Physiol. .

Abstract

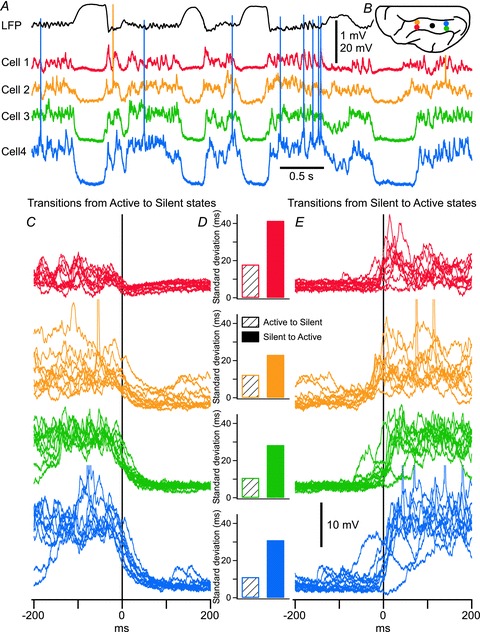
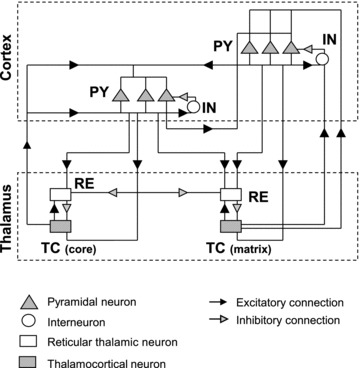
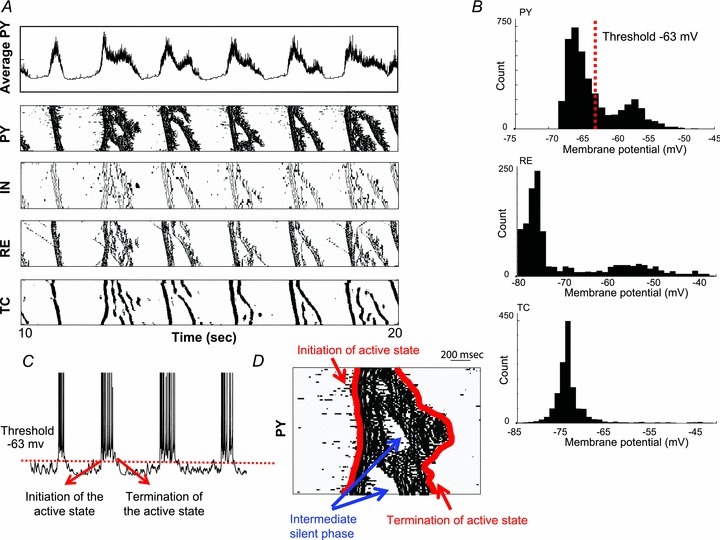
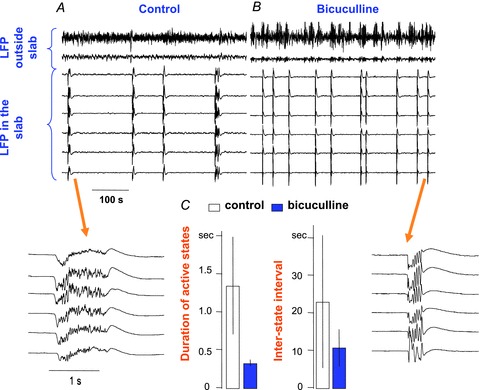
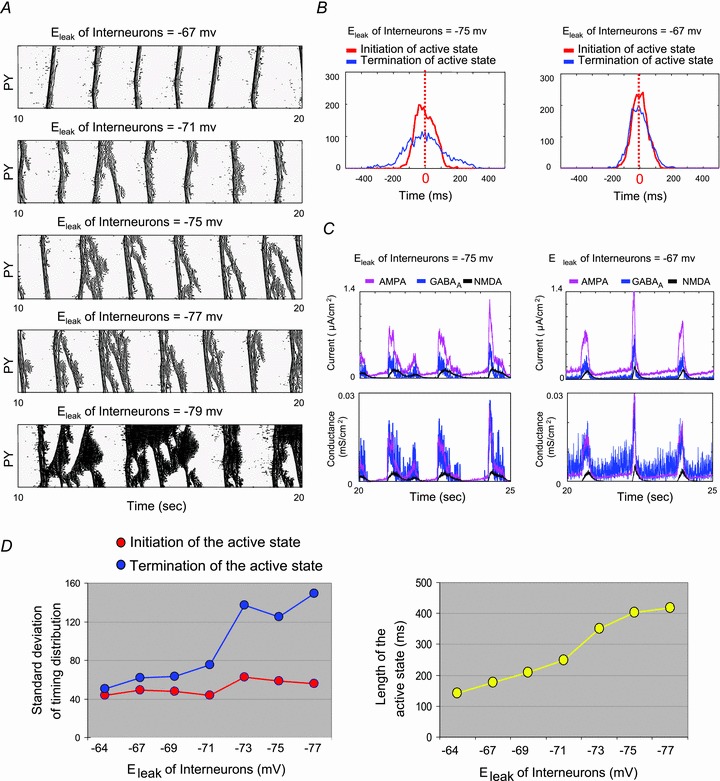
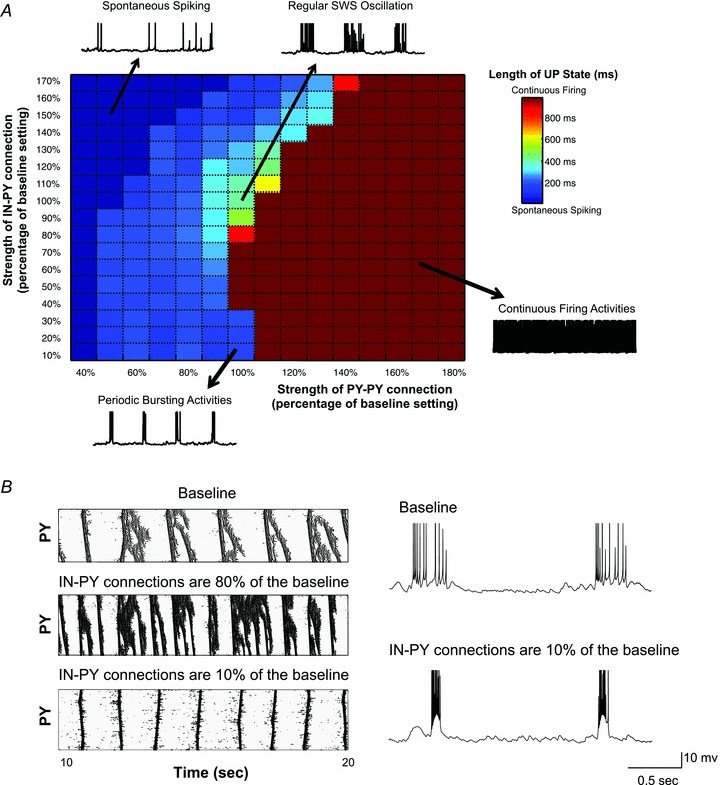
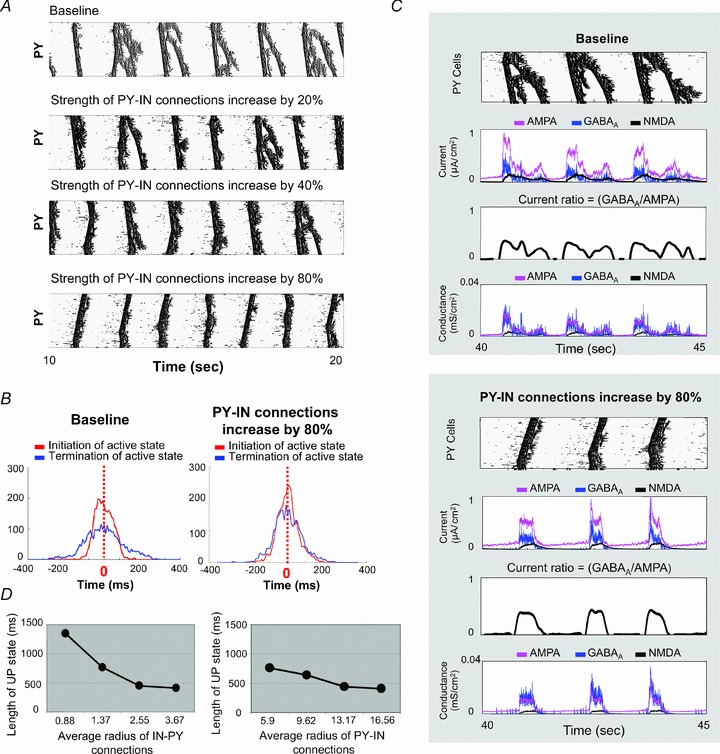
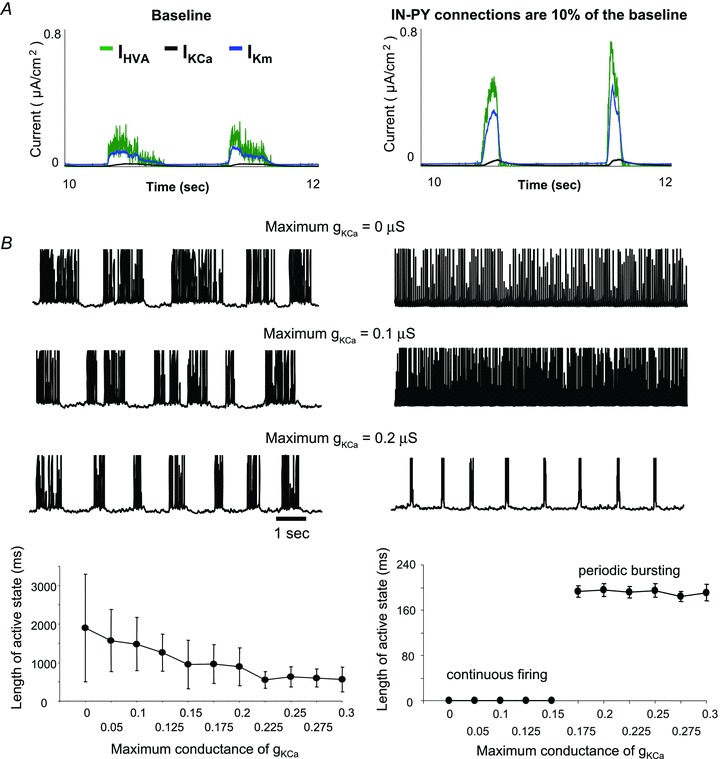
The signature of slow-wave sleep in the electroencephalogram (EEG) is large-amplitude fluctuation of the field potential, which reflects synchronous alternation of activity and silence across cortical neurons. While initiation of the active cortical states during sleep slow oscillation has been intensively studied, the biological mechanisms which drive the network transition from an active state to silence remain poorly understood. In the current study, using a combination of in vivo electrophysiology and thalamocortical network simulation, we explored the impact of intrinsic and synaptic inhibition on state transition during sleep slow oscillation. We found that in normal physiological conditions, synaptic inhibition controls the duration and the synchrony of active state termination. The decline of interneuron-mediated inhibition led to asynchronous downward transition across the cortical network and broke the regular slow oscillation pattern. Furthermore, in both in vivo experiment and computational modelling, we revealed that when the level of synaptic inhibition was reduced significantly, it led to a recovery of synchronized oscillations in the form of seizure-like bursting activity. In this condition, the fast active state termination was mediated by intrinsic hyperpolarizing conductances. Our study highlights the significance of both intrinsic and synaptic inhibition in manipulating sleep slow rhythms.


Figures

Figure 1
Figure 1. During slow oscillation, the termination of the active state is more synchronous across the cortical network than its initiation
A, segment of simultaneous quadruple intracellular and local field potential recordings performed in the suprasylvian gyrus of a cat anaesthetized with ketamine–xylazine. Action potentials of cell 2 (orange) are truncated. B, schematic representation of electrode locations. The colour code applies for all panels. In C and E, the superposition of 10 transitions from active to silent state (in C) and from silent to active state (in E) for the four neurons shown in A. Time zero corresponds to the cluster mean time of transition evaluated at the half-amplitude of the transition. Action potentials are truncated for clarity. D, standard deviation of transition delays between individual neurons and the cluster mean time are displayed. Open bars represent the standard deviation of the downward transition, and filled bars represent the standard deviation of the upward transition. In each recorded neuron, the standard deviation during upward transitions is much larger than that during downward transition.
Figure 3
Figure 3. Schematic diagram of the anatomical structure of the thalamocortical network model used in this study
The model contains two populations of thalamocortical (TC) neurons representing the core and matrix subsystems respectively. Furthermore, a population of thalamic reticular (RE) neurons, two populations of cortical (PY) neurons and a population of interneurons (INs) were also included. The black arrowheads indicate excitatory connections and the grey arrowheads represent inhibitory connections. The thalamocortical and corticothalamic projections in the matrix pathway were made more expansive than in the core pathway. The widths of all connections are summarized in Table 1.
Figure 4
Figure 4. Alternation of active and silent states during slow oscillation in the thalamocortical network model
A, representative trace of the average activity of all pyramidal neurons in the core subsytem (top) and the rastergrams of activity in different cell populations during 10 s of simulation. For each raster plot, the x-axis indicates time and the y-axis indicates cell index. Six spontaneous cycles of active and silent states were observed (frequency of oscillation ∼0.6 Hz). B, distributions of the membrane potential acquired from the entire population of PY (top), RE (middle) and TC (bottom) neurons during slow oscillation are displayed. The distributions obtained from PY and RE neurons show two peaks representing the activity during active and silent states respectively. On the other hand, the distribution obtained from TC neurons is unimodal. C, the timing of initiation/termination of an active state is defined as the time when the membrane potential of individual PY neurons crossed the threshold (−63 mv) that was selected between the two peaks of membrane potential distribution in B. D, definition of initiation and termination times of the active state is illustrated here. If the short-lasting hyperpolarizing period appeared in the middle of an active state, the termination time of an active state was defined at the end of this wave, and the short and intermediate silent phases were ignored.
Figure 2
Figure 2. Comparison of the duration of the active state under normal conditions (control) and a condition when GABAA receptors were blocked by the application of bicuculline in an isolated cortical slab in vivo
Two segments of 8 LFP recordings are displayed (6 in a cortical slab, 2 in the intact cortex) in A (control conditions) and B (after the application of bicuculline). Compared to controls, active state was much shorter when inhibition was blocked. C, mean (bar) and standard deviation (line) of the duration of the active state (left panel) and silent state (right panel) in the control conditions (open bars) and in the presence of bicuculline (filled bars) are shown. After inhibition was blocked by the application of bicuculline, both the active and silent states became shorter (P value <0.0001). Interstate interval was also significantly reduced in the presence of bicuculline (P value = 0.0064) (both statistics from an unpaired t test with Welch's correction).
Figure 5
Figure 5. Impact of interneuron excitability on the level of synchronization of state transition during slow oscillation
A, rastergrams of the network activity across a population of PY neurons were plotted under five different settings of equilibrium potentials of the non-specific leak current (Eleak) in inhibitory interneurons. When interneurons were more excitable (more positive value of Eleak), active states became shorter and the termination of active states became more synchronous across cell ensembles. B, the level of synchronization during a state transition is further evaluated by plotting the distribution of the times when state transitions occur across a population of pyramidal neurons (left panel: Eleak of interneurons is −75 mV; right panel: Eleak of interneurons is −67 mV). The red line indicates the distribution of upward transition, while the blue line shows the distribution of downward transition. The synchronous level of downward transitions (blue line) significantly improved as the interneurons became more excitable. C, the traces of synaptic currents (top panel) and the corresponding synaptic conductances (bottom panel), including AMPA, GABAA and NMDA, during 5 s of simulation are displayed. The traces on the right were obtained from a simulation setting in which the interneurons were more excitable (Eleak of interneurons = −67 mv) compared to the traces on the left (Eleak of interneurons = −75 mv). D, the standard deviation of the timing distributions (upward and downward transitions) under different settings of interneuron excitability is summarized in a plot (left). The synchronous level of upward transition stayed constant regardless the levels of interneuron excitability (red line). On the other hand, the synchronous level of downward transition was significantly enhanced (smaller values of standard deviation) when the interneurons became more excitable. Furthermore, the average duration of active states was found to be shorter as the interneurons became more excitable (right plot).
Figure 7
Figure 7. Influence of excitatory and inhibitory synaptic strength on the duration of active states during slow oscillation
A, the average length of active states is plotted based on different combinations of the strength of the intracortical excitatory (PY→PY) and inhibitory (IN→PY) connections. Sample traces of the PY neuron membrane potential illustrate typical examples of PY activity (e.g. spontaneous spiking, periodic bursting, regular slow oscillation, continuous firing). Colour bar indicates the average length of active states. B, the rastergrams and representative traces of the PY neuron membrane voltage were obtained from simulations with different strengths of the IN–PY neuron connection. Short and bursting activity appeared when the strength of the IN–PY neuron connection was significantly reduced (10% of the baseline in this case).
Figure 6
Figure 6. Impact of the strength and radius of PY neuron–IN connections on synchrony of downward transitions during sleep slow oscillation
A, four rastergrams acquired from simulations with different strength of PY neuron–IN connection (baseline, and increasing to 20%, 40% and 80% above the baseline). B, distributions of initiation and termination times of active state are displayed. Increasing the strength of PY neuron–IN improved the degree of synchrony of the downward transition (blue line) that approached the level of synchronization of the upward transition (red line). C, the rastergrams of PY activity, the traces of synaptic currents, the ratio of GABAA/AMPA, and the traces of synaptic conductances are plotted here. When the strength of PY neuron–IN connections was increased, the ratio GABAA/AMPA remained high till the end of active state. D, dependence of the duration of active state on the average width of IN–PY neuron or PY neuron–IN connections is shown.
Figure 8
Figure 8. Effect of intrinsic hyperpolarizing currents on active state duration and termination
A, traces of intrinsic currents, including a high threshold Ca2+ current (IHVA), a Ca2+-dependent K+ current (IKCa) and a slow voltage-dependent K+ current (IKm), were obtained from simulations with two different settings of synaptic inhibition (baseline or 10% of the baseline). When the strength of inhibitory connections was reduced by 90%, PY neurons showed a high spiking rate during active states. This caused an instant rise in the voltage- and Ca2+-dependent K+ currents and an immediate termination of active state. B, representative membrane voltage traces (top) and a summary of the duration of active state as a function of Ca2+-dependent K+ conductance, gKCa, (bottom) for two different settings of synaptic inhibition are shown here. Under weak IN–PY neuron connection setting (right column), decreasing the strength of gKCa prevented bursting activity in PY neurons and led to continuous firing.

References

    1. Abbott LF, Verela JA, Sen K, Nelson SB. Synaptic depression and cortical gain control. Science. 1997;275:220–224. - PubMed
    1. Achermann P, Borbely AA. Low-frequency (< 1 Hz) oscillations in the human sleep electroencephalogram. Neuroscience. 1997;81:213–222. - PubMed
    1. Alzheimer C, Schwindt PC, Grill WE. Modal gating of Na+ channels as a mechanism of persistent Na+ current in pyramidal neurons from rat and cat sensorimotor cortex. J Neurosci. 1993;13:660–673. - PMC - PubMed
    1. Bazhenov M, Timofeev I, Steriade M, Sejnowski TJ. Cellular and network models for intrathalamic augmenting responses during 10 Hz stimulation. J Neurophysiol. 1998;79:2730–2748. - PubMed
    1. Bazhenov M, Timofeev I, Steriade M, Sejnowski TJ. Model of thalamocortical slow-wave sleep oscillations and transitions to activated states. J Neurosci. 2002;22:8691–8704. - PMC - PubMed

Publication types

LinkOut - more resources