

Quantifying selection in high-throughput Immunoglobulin sequencing data sets
- PMID: 22641856
- PMCID: PMC3458526
- DOI: 10.1093/nar/gks457
Quantifying selection in high-throughput Immunoglobulin sequencing data sets
Abstract
High-throughput immunoglobulin sequencing promises new insights into the somatic hypermutation and antigen-driven selection processes that underlie B-cell affinity maturation and adaptive immunity. The ability to estimate positive and negative selection from these sequence data has broad applications not only for understanding the immune response to pathogens, but is also critical to determining the role of somatic hypermutation in autoimmunity and B-cell cancers. Here, we develop a statistical framework for Bayesian estimation of Antigen-driven SELectIoN (BASELINe) based on the analysis of somatic mutation patterns. Our approach represents a fundamental advance over previous methods by shifting the problem from one of simply detecting selection to one of quantifying selection. Along with providing a more intuitive means to assess and visualize selection, our approach allows, for the first time, comparative analysis between groups of sequences derived from different germline V(D)J segments. Application of this approach to next-generation sequencing data demonstrates different selection pressures for memory cells of different isotypes. This framework can easily be adapted to analyze other types of DNA mutation patterns resulting from a mutator that displays hot/cold-spots, substitution preference or other intrinsic biases.
Figures
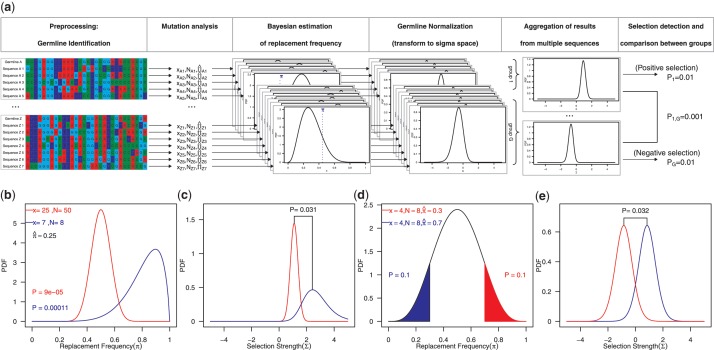
 ). (c and e) The posterior distributions that result after transforming to the Σ-space quantifying selection strength for the same sequences in [b] and [d] respectively.
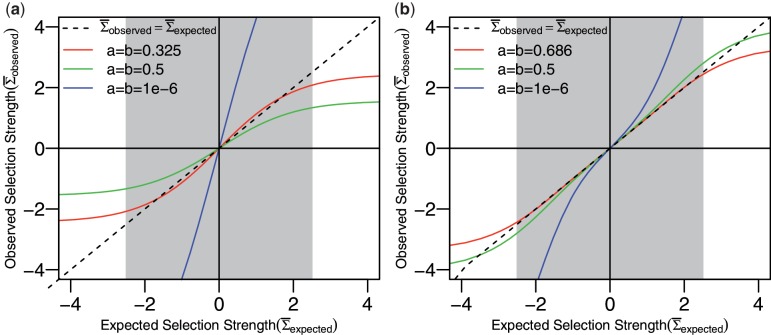
 .
.
 . The hyperparameters for the Bayesian prior were estimated for each value of N (N = 10 here) at
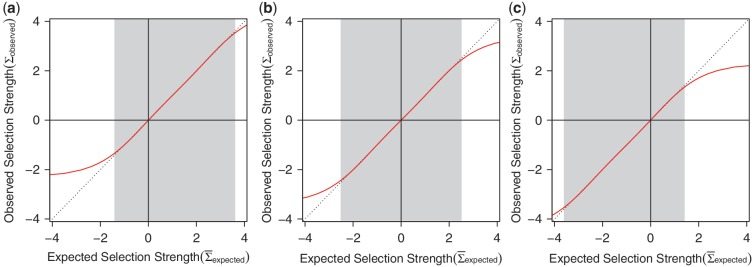
  by fitting within the shaded region (b). Although the hyperparameters remain fixed, the interval of optimal estimation (shaded) will shift for different values of
  [0.25 in (a) and 0.75 in (c)].
References
Publication types
MeSH terms
Substances
Grants and funding
LinkOut - more resources
Full Text Sources
Other Literature Sources
Molecular Biology Databases
