

doi: 10.1111/j.1538-7836.2012.04799.x.
Is there value in kinetic modeling of thrombin generation? Yes
Affiliations
- PMID: 22642417
- PMCID: PMC4553947
- DOI: 10.1111/j.1538-7836.2012.04799.x
Item in Clipboard
Is there value in kinetic modeling of thrombin generation? Yes
J Thromb Haemost.
2012 Aug.
No abstract available
Conflict of interest statement
CONFLICT OF INTEREST DISCLOSURE: Kenneth Mann is COB of Haematologic Technologies Inc.
Figures
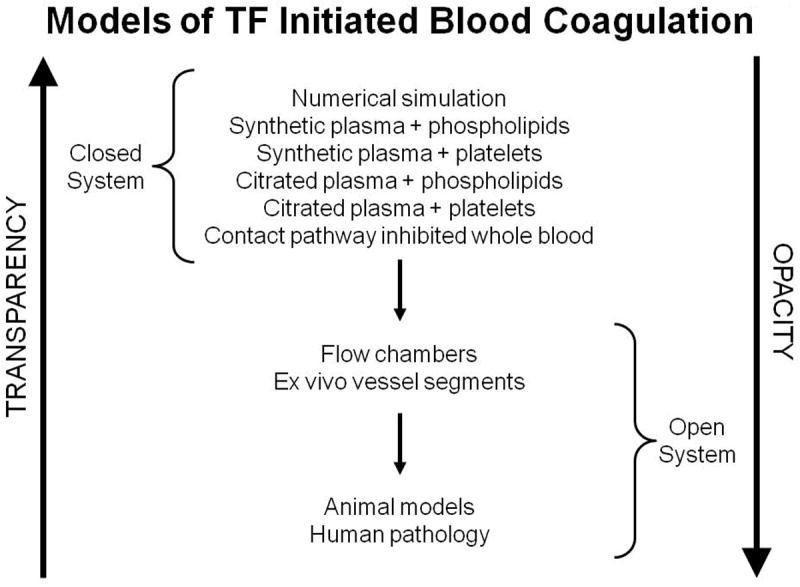
The gradients of biochemical “transparency” and biological “opacity” proceeding from numerical models to human biology [62]. This research was originally published in: Mann KG, Brummel-Ziedins K, Orfeo T, Butenas S. Models of blood coagulation. Blood Cells Mol Dis. 2006; 36: 108-17. With permission.
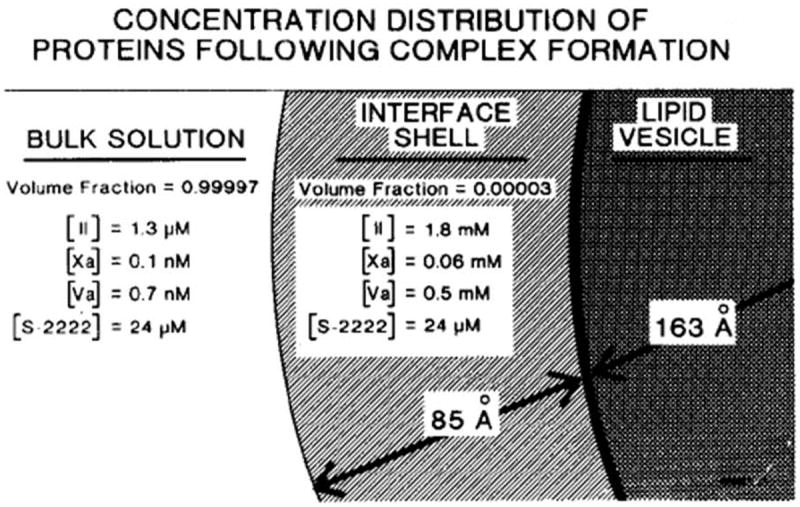
Model depicting distributions of prothrombin, FXa, and FVa between bulk solution and the phospholipid vesicle in the assembly of prothrombinase [38]. The region designated as interface shell is presumed that in which enzyme (FXa) and substrate concentrate, and in which catalysis occurs. The volume of this region is about 4.6 × 10⁻²⁰ liters/vesicle. The indicated concentrations are those which apply at equilibrium and were calculated from the initial concentrations stated in the text and published binding parameters for the interactions of the various species with phospholipid vesicles and each other. The indicated distribution of components plus the enhanced Vmax conferred by FVa are sufficient to enhance the rate of prothrombin conversion (per unit volume of bulk solution) by a factor of 2.8 × 10⁵. This research was originally published in J Biol Chem. Nesheim ME, Eid S, Mann KG. Assembly of the prothrombinase complex in the absence of prothrombin. J Biol Chem. 1981; 256: 9874-82. © The American Society for Biochemistry and Molecular Biology.
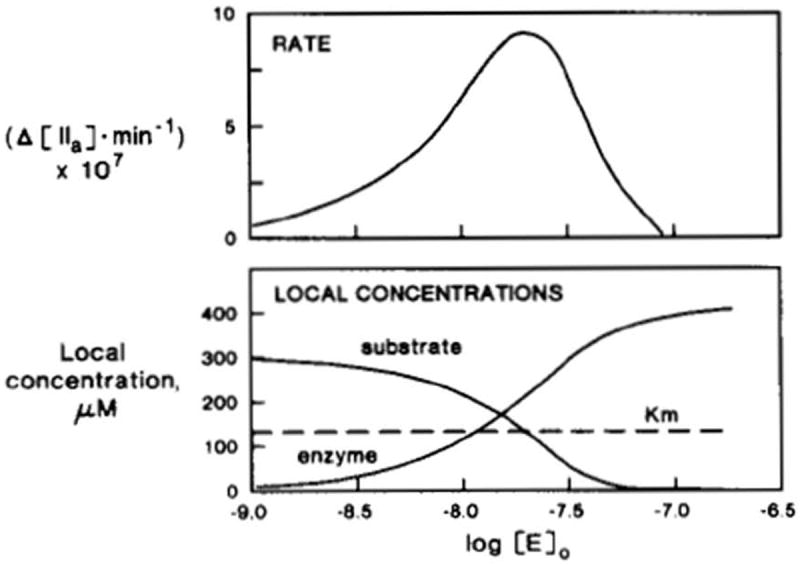
Simulated inhibition of initial rates of prothrombin activation by excess enzyme [39]. The logarithms of enzyme concentrations are indicated by the units of the horizontal axis. Top, simulated reaction rates (moles of thrombin*min-1) are shown; bottom, local (interface shell) concentrations are shown for both substrate and enzyme. With increased levels of added enzyme, its local concentration increases, resulting in increased reaction rates. Excess enzyme, however, competes with the substrate in the interface shell, lowering its local concentration, thus resulting in decreased reaction rates. This research was originally published in J Biol Chem. Nesheim ME, Tracy RP, Mann KG. “Clotspeed,” a mathematical simulation of the functional properties of prothrombinase. J Biol Chem. 1984; 259: 1447-53. © The American Society for Biochemistry and Molecular Biology.
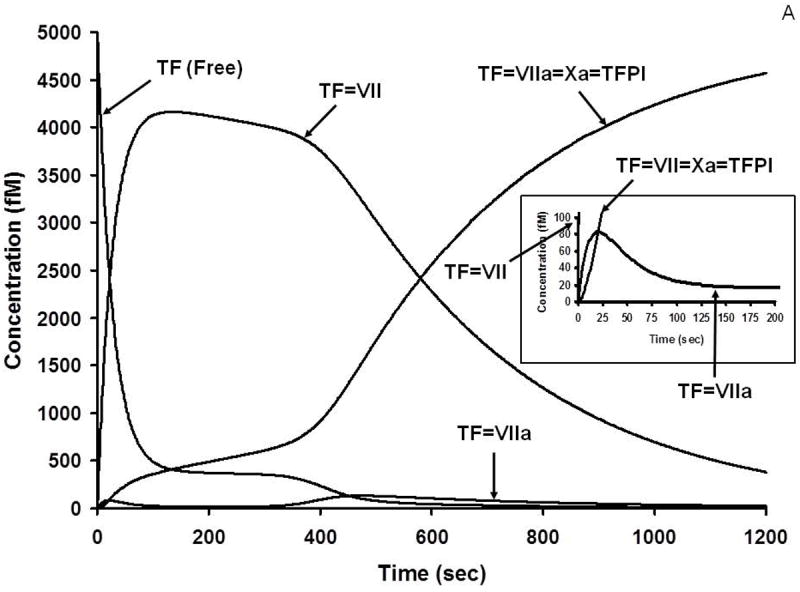
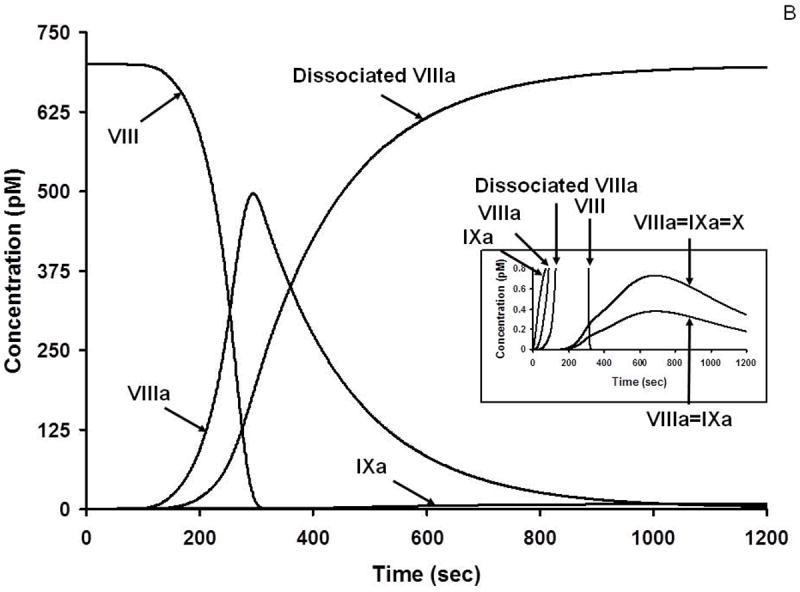
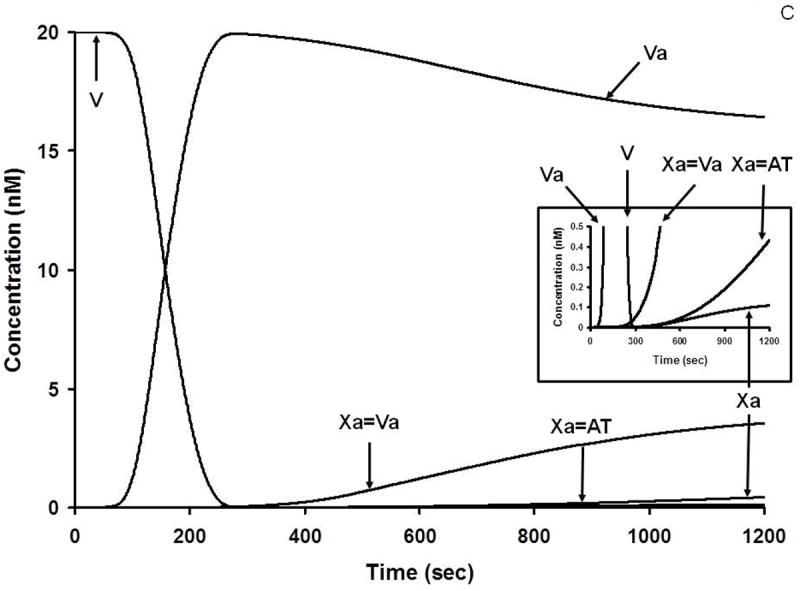
A. Numerical simulation: the formation of TF complexes during coagulation [10]. The reaction in electronic plasma is started by addition of 5 pM TF (t = 0). Data are expressed as metabolite concentration (femtomolar) versus time (s). Early formation of TF-FVIIa-FXa-TFPI complex is also shown (inset). This research was originally published in J Biol Chem. Orfeo T, Butenas S, Brummel-Ziedins KE, Mann KG. The tissue factor requirement in blood coagulation. J Biol Chem. 2005; 280: 42887-96. © The American Society for Biochemistry and Molecular Biology. B. Numerical simulation: the formation of VIIIa complexes during coagulation. The reaction in electronic plasma is started by addition of 5 pM TF (t = 0). Data are expressed as metabolite concentration (picomolar) versus time (s). Complexes in the subpicomolar concentration range are also shown (inset). This research was originally published in J Biol Chem. Orfeo T, Butenas S, Brummel-Ziedins KE, Mann KG. The tissue factor requirement in blood coagulation.J Biol Chem. 2005; 280: 42887-96. © The American Society for Biochemistry and Molecular Biology. C. Numerical simulation: the formation of Va and Xa complexes during coagulation. The reaction in electronic plasma is started by addition of 5 pM TF (t = 0). Data are expressed as metabolite concentration (nanomolar) versus time (s). Complexes in the subnanomolar concentration range are also shown (inset). This research was originally published in J Biol Chem. Orfeo T, Butenas S, Brummel-Ziedins KE, Mann KG. The tissue factor requirement in blood coagulation. J Biol Chem. 2005; 280: 42887-96. © The American Society for Biochemistry and Molecular Biology.
A. Numerical simulation: the formation of TF complexes during coagulation [10]. The reaction in electronic plasma is started by addition of 5 pM TF (t = 0). Data are expressed as metabolite concentration (femtomolar) versus time (s). Early formation of TF-FVIIa-FXa-TFPI complex is also shown (inset). This research was originally published in J Biol Chem. Orfeo T, Butenas S, Brummel-Ziedins KE, Mann KG. The tissue factor requirement in blood coagulation. J Biol Chem. 2005; 280: 42887-96. © The American Society for Biochemistry and Molecular Biology. B. Numerical simulation: the formation of VIIIa complexes during coagulation. The reaction in electronic plasma is started by addition of 5 pM TF (t = 0). Data are expressed as metabolite concentration (picomolar) versus time (s). Complexes in the subpicomolar concentration range are also shown (inset). This research was originally published in J Biol Chem. Orfeo T, Butenas S, Brummel-Ziedins KE, Mann KG. The tissue factor requirement in blood coagulation.J Biol Chem. 2005; 280: 42887-96. © The American Society for Biochemistry and Molecular Biology. C. Numerical simulation: the formation of Va and Xa complexes during coagulation. The reaction in electronic plasma is started by addition of 5 pM TF (t = 0). Data are expressed as metabolite concentration (nanomolar) versus time (s). Complexes in the subnanomolar concentration range are also shown (inset). This research was originally published in J Biol Chem. Orfeo T, Butenas S, Brummel-Ziedins KE, Mann KG. The tissue factor requirement in blood coagulation. J Biol Chem. 2005; 280: 42887-96. © The American Society for Biochemistry and Molecular Biology.
A. Numerical simulation: the formation of TF complexes during coagulation [10]. The reaction in electronic plasma is started by addition of 5 pM TF (t = 0). Data are expressed as metabolite concentration (femtomolar) versus time (s). Early formation of TF-FVIIa-FXa-TFPI complex is also shown (inset). This research was originally published in J Biol Chem. Orfeo T, Butenas S, Brummel-Ziedins KE, Mann KG. The tissue factor requirement in blood coagulation. J Biol Chem. 2005; 280: 42887-96. © The American Society for Biochemistry and Molecular Biology. B. Numerical simulation: the formation of VIIIa complexes during coagulation. The reaction in electronic plasma is started by addition of 5 pM TF (t = 0). Data are expressed as metabolite concentration (picomolar) versus time (s). Complexes in the subpicomolar concentration range are also shown (inset). This research was originally published in J Biol Chem. Orfeo T, Butenas S, Brummel-Ziedins KE, Mann KG. The tissue factor requirement in blood coagulation.J Biol Chem. 2005; 280: 42887-96. © The American Society for Biochemistry and Molecular Biology. C. Numerical simulation: the formation of Va and Xa complexes during coagulation. The reaction in electronic plasma is started by addition of 5 pM TF (t = 0). Data are expressed as metabolite concentration (nanomolar) versus time (s). Complexes in the subnanomolar concentration range are also shown (inset). This research was originally published in J Biol Chem. Orfeo T, Butenas S, Brummel-Ziedins KE, Mann KG. The tissue factor requirement in blood coagulation. J Biol Chem. 2005; 280: 42887-96. © The American Society for Biochemistry and Molecular Biology.
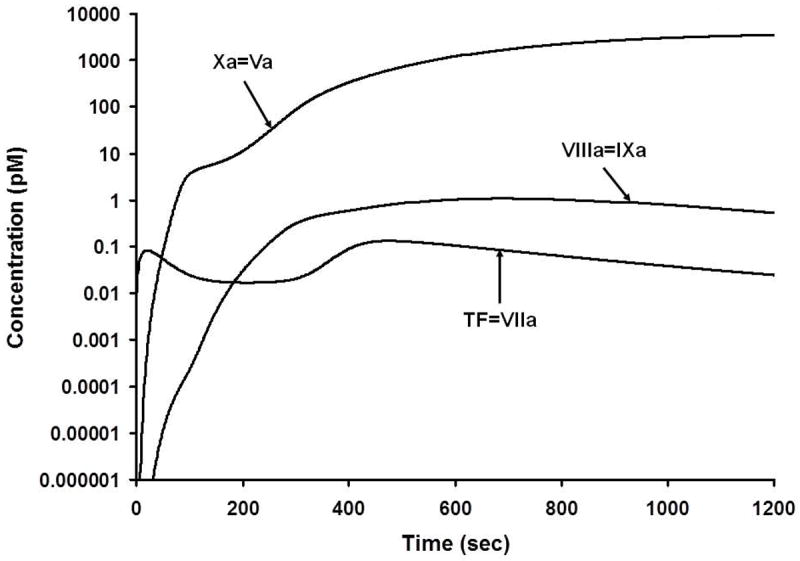
Numerical simulation of the active procoagulant complexes. The scale is logarithmic and illustrates the generation of these complexes from their onset at subfemtomolar levels. Mann, KG. Thrombin generation in hemorrhage control and vascular occlusion. Circulation. 124:225-35, 2011. PMID: 21747067
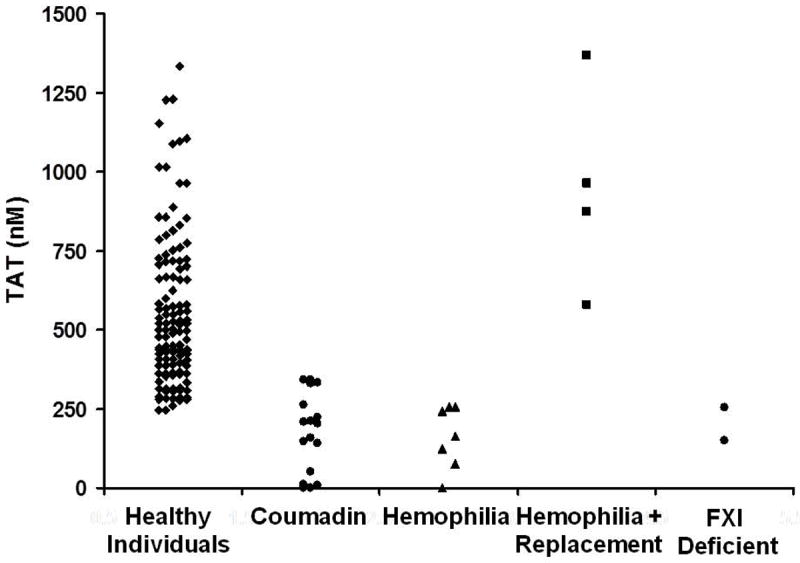
Thrombin–antithrombin (TAT) levels at 20 min as an evaluator of an individual’s hemostatic competence [53]. TAT at 20 min is illustrated for our group of 119 controls conducted over a 7-year time period, showing thrombin values ranging from approximately 250 to 1350 nM. Also represented are TAT data for individuals undergoing warfarin therapy, as well as individuals with hemophilia (with and without replacement) and FXI deficiency. Modified from: Brummel-Ziedins KE, Pouliot RL, Mann KG. Thrombin generation: phenotypic quantitation. J Thromb Haemost. 2004; 2: 281-8. With Permission.
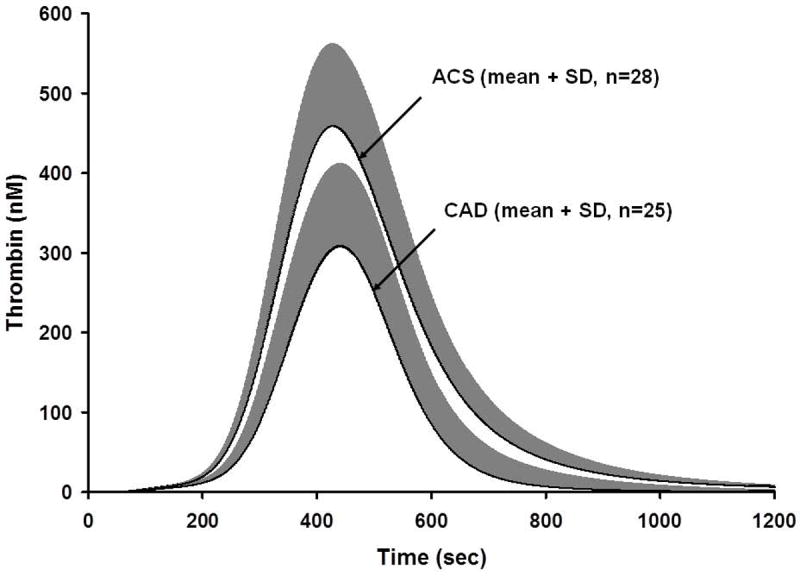
Thrombin simulations of acute coronary syndrome (ACS) and coronary artery disease (CAD) populations [55]. Plasma compositions from 28 ACS individuals and 25 CAD individuals were used to generate thrombin simulations over 1200 s. Data are shown as the mean for the ACS and CAD population. This research was originally published in: Brummel-Ziedins K, Undas A, Orfeo T, Gissel M, Butenas S, Zmudka K, Mann KG. Thrombin generation in acute coronary syndrome and stable coronary artery disease: dependence on plasma factor composition. J Thromb Haemost. 2008; 6: 104-10.
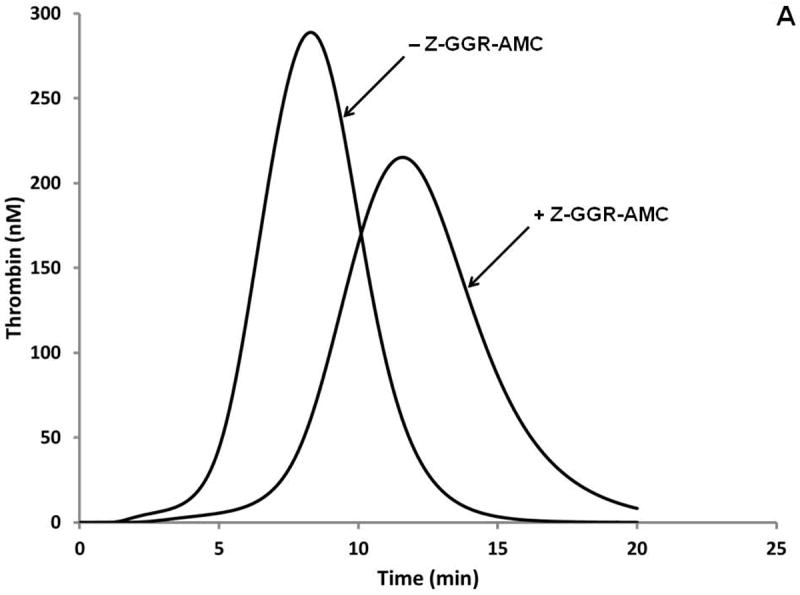
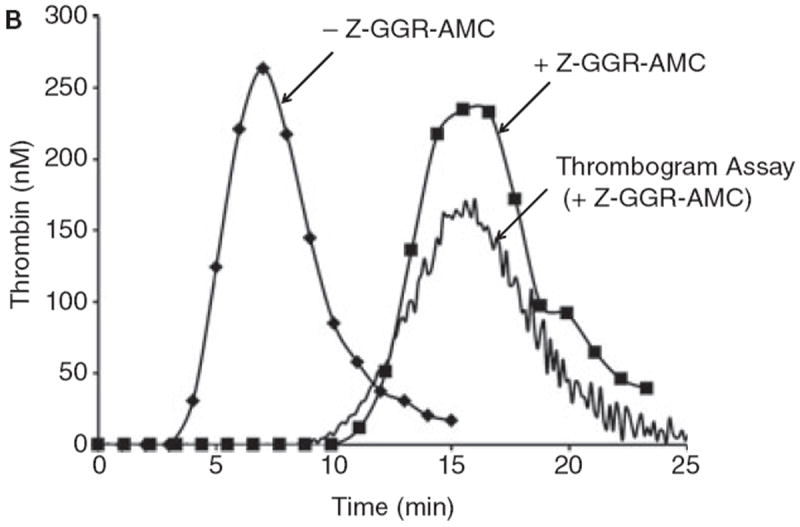
A. Simulations of the activation of the “normal” plasma proteome ± Z-GGR-AMC at 418 μM. B. Synthetic proteome activation by 5 pM Tf with 50 μM phosphatidyl serine/phosphatidyl choline (25%:75%). Represented are the control with subsampling (no Z-GGR-AMC, diamonds); in the presence of 418 μM Z-GGR-AMC with subsampling (squares) and by continuous monitoring of Z-GGR-AMC hydrolysis (solid line). Note that the empirical curves with Z-GGR-AMC are right-shifted relative to the predictive curves of Figure 8A.
A. Simulations of the activation of the “normal” plasma proteome ± Z-GGR-AMC at 418 μM. B. Synthetic proteome activation by 5 pM Tf with 50 μM phosphatidyl serine/phosphatidyl choline (25%:75%). Represented are the control with subsampling (no Z-GGR-AMC, diamonds); in the presence of 418 μM Z-GGR-AMC with subsampling (squares) and by continuous monitoring of Z-GGR-AMC hydrolysis (solid line). Note that the empirical curves with Z-GGR-AMC are right-shifted relative to the predictive curves of Figure 8A.
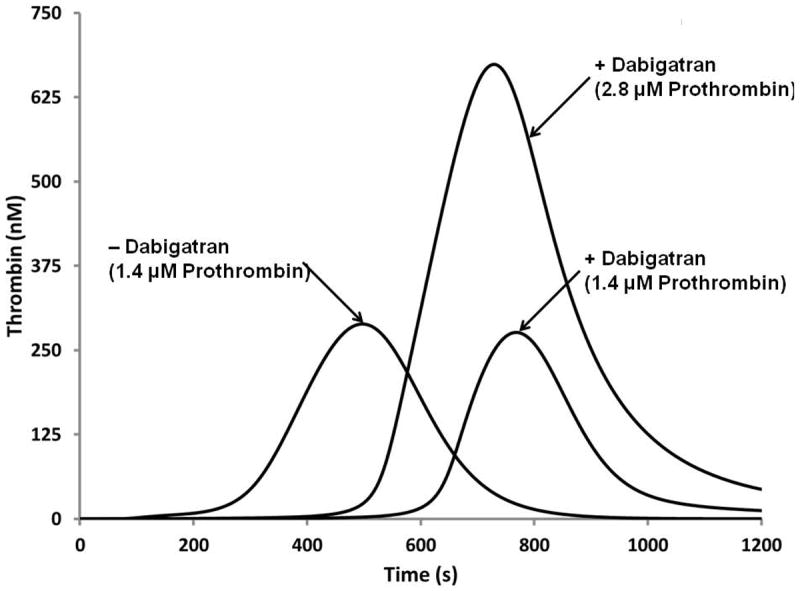
Numerical simulation of the reversal of dabigatran therapy with exogenous prothrombin. Dabigatran concentration (250 nM) is the effective Cmax concentration at the pharmacokinetic 50th percentile. Three curves are illustrated; a “normal” thrombin generation curve with 1.4 μM prothrombin, the same numerical proteome mixture with Dabigatran added and the latter to which a 100% increase in prothrombin is included.
Comment in
-
Is there value in kinetic modeling of thrombin generation? No (unless…).J Thromb Haemost. 2012 Aug;10(8):1470-7. doi: 10.1111/j.1538-7836.2012.04802.x. J Thromb Haemost. 2012. PMID: 22650179 No abstract available.
References
-
- Pool JG. Cryoprecipitated factor VIII concentrate. Thromb Diath Haemorrh Suppl. 1968;35:35–40. - PubMed
-
- Langdell RD, Wagner RH, Brinkhous KM. Effect of antihemophilic factor on one-stage clotting tests; a presumptive test for hemophilia and a simple one-stage antihemophilic factor assy procedure. J Lab Clin Med. 1953;41:637–47. - PubMed
-
- Hockin MF, Jones KC, Everse SJ, Mann KG. A model for the stoichiometric regulation of blood coagulation. J Biol Chem. 2002;277:18322–33. - PubMed
-
- Lawson JH, Kalafatis M, Stram S, Mann KG. A model for the tissue factor pathway to thrombin. I. An empirical study. J Biol Chem. 1994;269:23357–66. - PubMed
Publication types
MeSH terms
Substances
Grants and funding
LinkOut - more resources
Full Text Sources
