. 2012 Jul;24(4):688-95.
doi: 10.1177/1040638712445770. Epub 2012 May 29.

Serum osmolality and effects of water deprivation in captive Asian elephants (Elephas maximus)

Affiliations

Serum osmolality and effects of water deprivation in captive Asian elephants (Elephas maximus)

Natalie H Hall et al. J Vet Diagn Invest. 2012 Jul.

Abstract

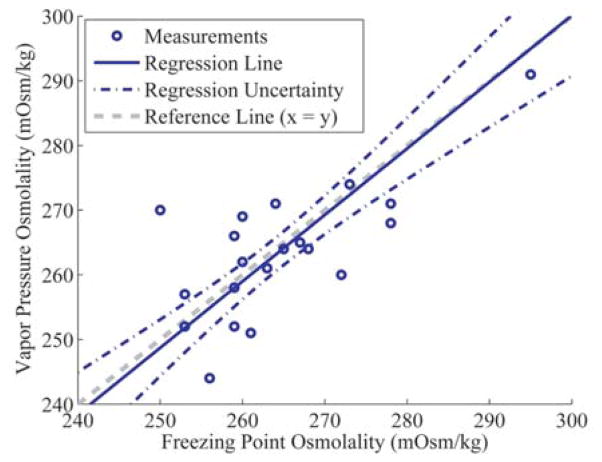
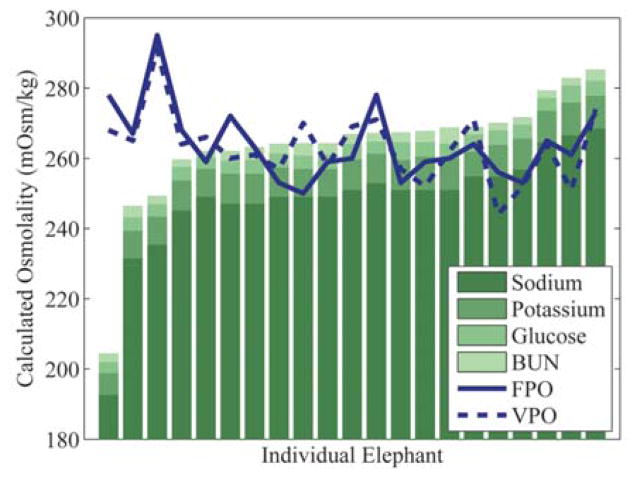
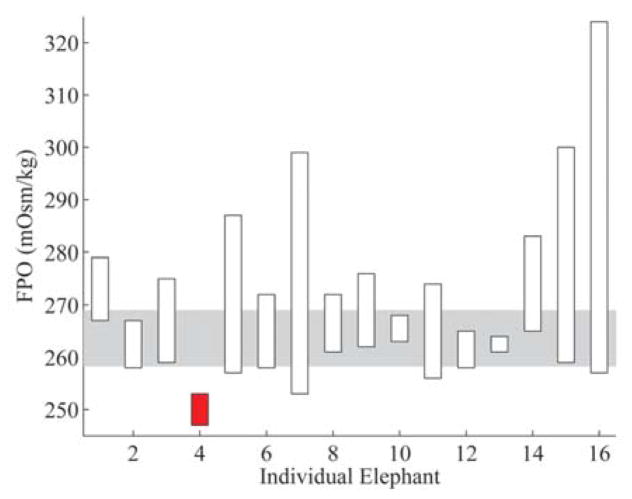
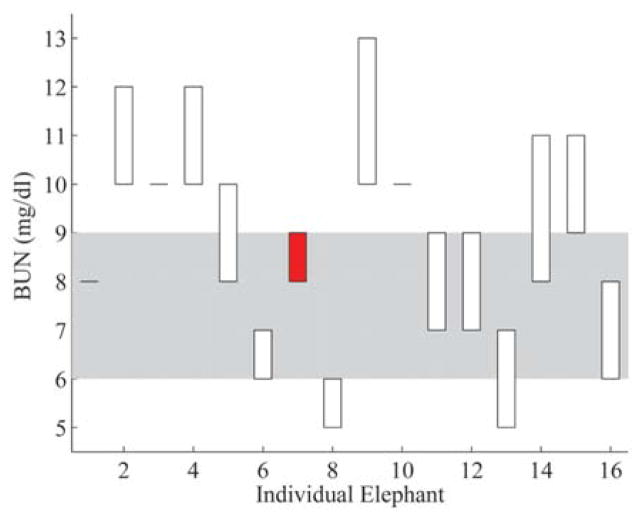
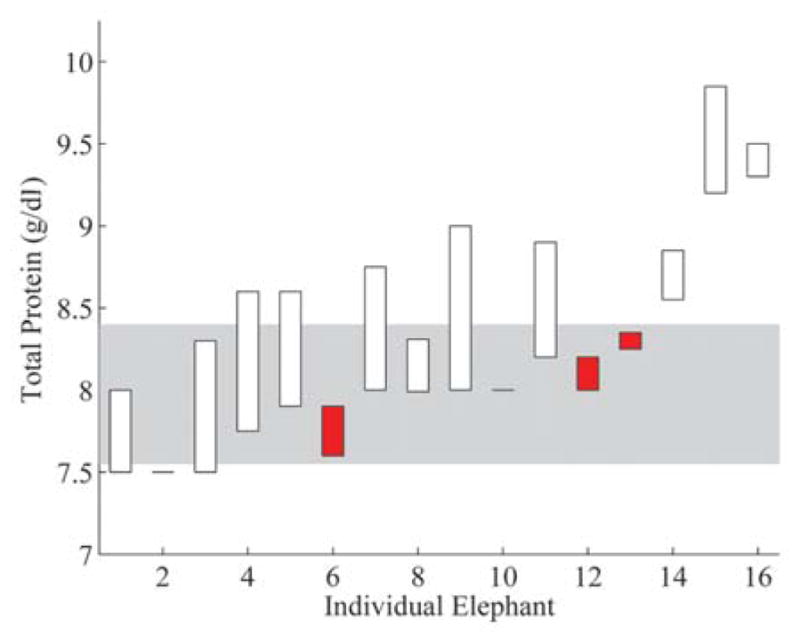
Serum from 21 healthy, captive Asian elephants (Elephas maximus) was evaluated by measured and calculated osmolality. Serum osmolality results for this population of Asian elephants had a median of 261 mOsm/kg and an interquartile interval of 258-269 mOsm/kg when measured by freezing point osmometry and a median of 264 mOsm/kg and an interquartile interval of 257-269 mOsm/kg when measured by vapor pressure osmometry. These values are significantly lower than values reported in other mammalian species and have important diagnostic and therapeutic implications. Calculated osmolality produced unreliable results and needs further study to determine an appropriate formula and its clinical application in this species. A 16-hr water deprivation test in 16 Asian elephants induced a small, subclinical, but statistically significant increase in measured serum osmolality. Serum osmolality, blood urea nitrogen, and total protein by refractometer were sensitive indicators of hydration status. Serum osmolality measurement by freezing point or vapor pressure osmometry is a useful adjunct to routine clinical tests in the diagnostic evaluation of elephants.


Conflict of interest statement

Declaration of conflicting interests

The author(s) declared no potential conflicts of interest with respect to the research, authorship, and/or publication of this article.

Figures

Figure 1
Figure 1
Deming regression of Asian elephant (Elephas maximus) serum freezing point osmometer (FPO) and vapor pressure osmometer (VPO) results, where VPO = a + b(FPO). The elephant samples obtained an intercept (a) of 6 ± 61 and a slope (b) of 0.97 ± 0.23. Linear bounds represent the uncertainty in the Deming regression line estimate.
Figure 2
Figure 2
Asian elephant (Elephas maximus) serum calculated osmolality bar graph with overlaid serum osmometer results. Elephants are sorted on the x-axis in ascending simple formula osmolality (SFO) value. BUN = blood urea nitrogen; FPO = freezing point osmometer values; VPO = vapor pressure osmometer values. Calculated osmolality values shown were generated by SFO. Bars exhibit proportional contribution of solutes used in the SFO formula.
Figure 3
Figure 3
Freezing point osmolality (FPO) results from the water deprivation test. Elephants are listed on the x-axis and FPO values are on the y-axis. Corresponding results are displayed for each elephant as bars showing the difference between the T0 and T1 FPO values. Unfilled bars indicate elephants with an increase in FPO and filled bars indicate elephants with a decrease in FPO over the water deprivation period. The shaded area represents the interquartile interval obtained from phase 1 results.
Figure 4
Figure 4
Blood urea nitrogen (BUN) results from the water deprivation test. Elephants are listed on the x-axis in the same order as Figure 3, and BUN values are on the y-axis. Corresponding results are displayed for each elephant as bars showing the difference between the T0 and T1 BUN values. Unfilled bars indicate elephants with an increase in BUN, and filled bars indicate elephants with a decrease in BUN over the water deprivation period. The shaded area represents the interquartile interval obtained from phase 1 results.
Figure 5
Figure 5
Total protein by refractometer results from the water deprivation test. Elephants are listed on the x-axis in the same order as Figure 3 and total protein (refractometer) values are on the y-axis. Corresponding results are displayed for each elephant as bars showing the difference between the T0 and T1 total protein values. Unfilled bars indicate elephants with an increase in total protein and filled bars indicate elephants with a decrease in total protein over the water deprivation period. The shaded area represents the interquartile interval obtained from phase 1 results.

References

    1. Acierno MJ, Mitchell MA, Freeman DM, et al. Determination of plasma osmolality and agreement between measured and calculated values in healthy adult Hispaniolan Amazon parrots (Amazona ventralis) Am J Vet Res. 2009;70:1151–1154. - PubMed
    1. Church D. Electrolyte disorders. In: Ettinger SJ, Feldman EC, editors. Textbook of veterinary internal medicine. 6. Saunders Elsevier; Philadelphia, PA: 2004. pp. 236–240.
    1. Dibartola SP, Bateman S. Introduction to fluid therapy. In: DiBartola SP, editor. Fluid, electrolyte, and acid-base disorders in small animal practice. 3. Saunders; St. Louis, MO: 2006. pp. 325–344.
    1. Dibartola SP, Green RA, Autran De Morais HS, Willard MD. Electrolyte and acid-base disorders. In: Willard MD, Tvedten H, Turnwald GH 3rd, editors. Small animal clinical diagnosis by laboratory methods. WB Saunders; Philadelphia, PA: 1999. pp. 94–107.
    1. Dunn FL, Brennan TJ, Nelson AE, Robertson GL. The role of blood osmolality and volume in regulating vasopressin secretion in the rat. J Clin Invest. 1973;52:3212–3219. - PMC - PubMed

Publication types

LinkOut - more resources