. 2012 Sep;143(3):589-598.e3.
doi: 10.1053/j.gastro.2012.05.036. Epub 2012 May 27.

Abnormal initiation and conduction of slow-wave activity in gastroparesis, defined by high-resolution electrical mapping

Affiliations

Abnormal initiation and conduction of slow-wave activity in gastroparesis, defined by high-resolution electrical mapping

Gregory O'Grady et al. Gastroenterology. 2012 Sep.

Abstract

Background & aims: Interstitial cells of Cajal (ICC) generate slow waves. Disrupted ICC networks and gastric dysrhythmias are each associated with gastroparesis. However, there are no data on the initiation and propagation of slow waves in gastroparesis because research tools have lacked spatial resolution. We applied high-resolution electrical mapping to quantify and classify gastroparesis slow-wave abnormalities in spatiotemporal detail.

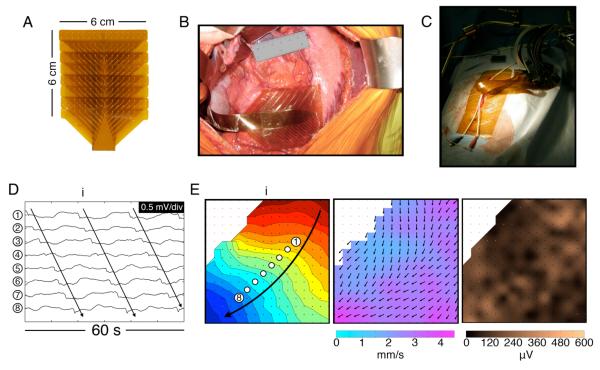
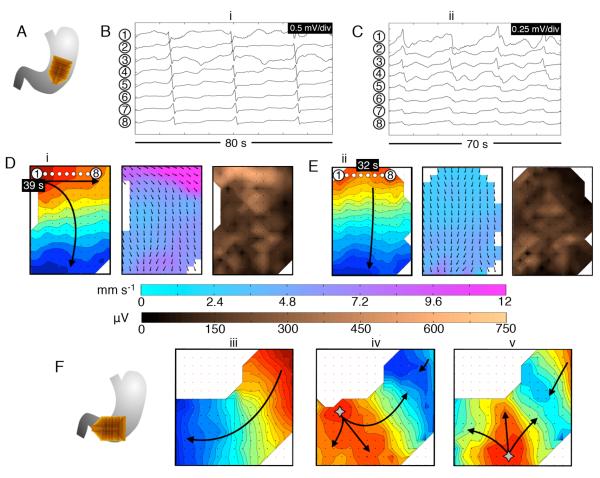
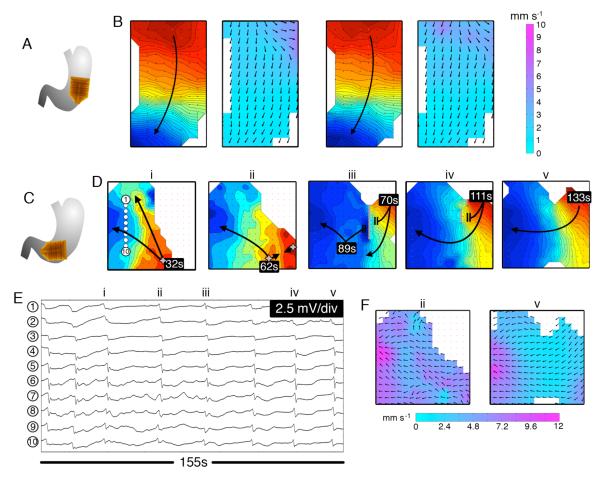
Methods: Serosal high-resolution mapping was performed using flexible arrays (256 electrodes; 36 cm(2)) at stimulator implantation in 12 patients with diabetic or idiopathic gastroparesis. Data were analyzed by isochronal mapping, velocity and amplitude field mapping, and propagation animation. ICC numbers were determined from gastric biopsy specimens.

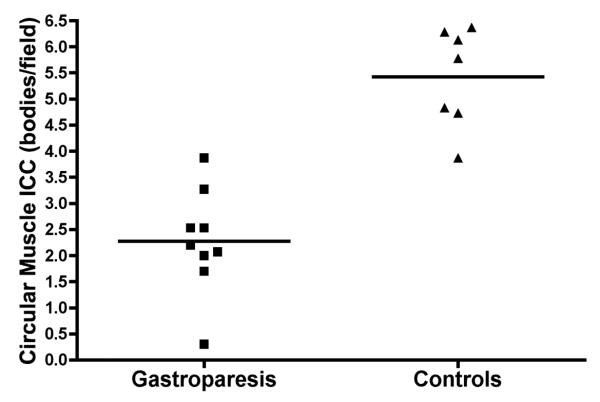
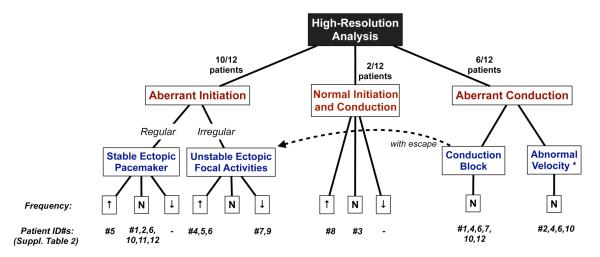
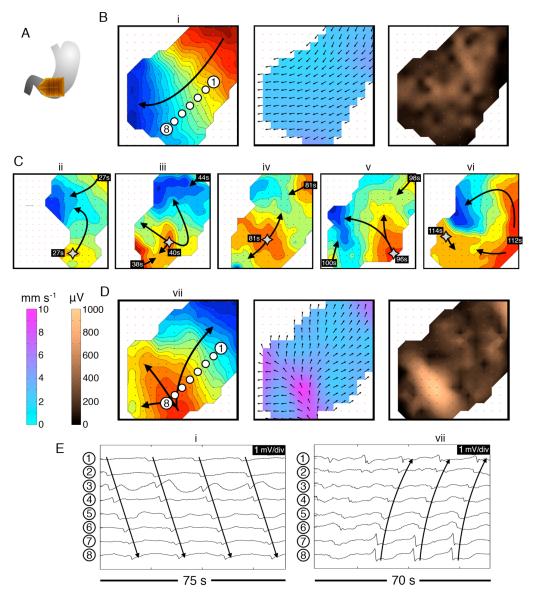
Results: Mean ICC counts were reduced in patients with gastroparesis (2.3 vs 5.4 bodies/field; P < .001). Slow-wave abnormalities were detected by high-resolution mapping in 11 of 12 patients. Several new patterns were observed and classified as abnormal initiation (10/12; stable ectopic pacemakers or diffuse focal events; median, 3.3 cycles/min; range, 2.1-5.7 cycles/min) or abnormal conduction (7/10; reduced velocities or conduction blocks; median, 2.9 cycles/min; range, 2.1-3.6 cycles/min). Circumferential conduction emerged during aberrant initiation or incomplete block and was associated with velocity elevation (7.3 vs 2.9 mm s(-1); P = .002) and increased amplitudes beyond a low base value (415 vs 170 μV; P = .002).

Conclusions: High-resolution mapping revealed new categories of abnormal human slow-wave activity. Abnormalities of slow-wave initiation and conduction occur in gastroparesis, often at normal frequency, which could be missed by tests that lack spatial resolution. Irregular initiation, aberrant conduction, and low amplitude activity could contribute to the pathogenesis of gastroparesis.


Figures

Figure 1
Figure 1
HR mapping methods. A. Flexible PCB array (16×16 electrodes at 4 mm spacing). B. Photo of the array placed on the corpus-antrum border. C. During mapping, the wound edges were approximated and cables fixed to a retractor. D. Electrograms from 8 channels from the positions indicated in (E) (frequency 3.2 ± 0.1 SD c/min) (Patient ID#3 in Suppl. Table 2). E. Left: isochronal activation map of the wavefront (i) indicated in (D), showing normal propagation. Each dot represents an electrode, and each color band shows the area of slow-wave propagation per 2 s (the ‘isochronal interval’). An animation sequence of this data is presented in Figure1.wmv. Middle: Velocity field map of the same wavefront (i), showing the speed (color spectrum) and direction (arrows) of the wavefront at each point on the array. Propagation is faster nearer the greater curvature . Right: Amplitude map of the same wavefront (i).
Figure 2
Figure 2
Comparison of gastric circular muscle ICC counts between the gastroparesis patients and matched controls (mean difference 3.2 bodies/field [CI: 2.1, 4.2]; P<0.0001).
Figure 3
Figure 3
Classification of slow-wave abnormalities in this study. Patients #1-8 had diabetic gastroparesis and patients #9-12 idiopathic; no differences in dysrhythmic patterns were apparent between these groups in this cohort. *Refers to the velocity of longitudinal conduction components only.
Figure 4
Figure 4
Abnormal slow-wave initiation: unstable focal events and stable ectopic pacemaking; examples from diabetic gastroparesis (ID#5). Isochronal intervals = 1 s. A. Position diagram. B. Normal activity was initially mapped for 280 s (freq. 3.3 ± 0.1 SD c/min). Isochrone, velocity and amplitude maps are shown for example wave (i) (see also animation Figure4i.wmv). C. An irregular tachygastria followed, due to unstable ectopic events arising at multiple locations (stars; duration ~200 s). Isochronal maps of 5 representative cycles (ii-vi) demonstrate chaotic tissue activation and wave collisions, resulting in a range or frequencies across the mapped field (median 3.7 c/min; range: 1.4 – 5.7). Time stamps are referenced to the accompanying animation (Figure4ii.wmv). D. Regular tachygastria followed, due to stable ectopic activity (freq. 4.0 ± 0.05 SD c/min), with organized retrograde propagation occurring until the end of the recording period. Isochrone, velocity and amplitude maps are shown for example wave (vii) (see also animation Figure 4iii.wmv). During aberrant initiation, circumferential slow-wave propagation emerged, and was faster than normal longitudinal conduction (6.4 ± 2.0 SD vs 2.8 ± 0.7 SD mm s−1; P<0.001), with higher amplitudes (595 ± 225 SD vs 240 ± 150 SD μV; P<0.001). E. Representative electrograms from waves (i) and (vii), from the channels shown in B,D.
Figure 5
Figure 5
Abnormal slow-wave initiation at low frequency. A. Position diagram relating to (B-E); diabetic gastroparesis (ID#1). B,D. Stable ectopic pacemaking originated near the lesser curvature of the mid-corpus, at a slightly lower than normal frequency (2.4 ± 0.05 SD c/min). Isochronal (intervals = 1s), velocity and amplitude maps are shown for typical wave (i) (see also animation Figure5i.wmv). C,E. The ectopic pacemaker was transient, being followed by activity of normal pattern and frequency (3.0 ± 0.05 SD c/min). Maps are shown for representative wave (ii) (see also animation Figure5ii.wmv). During ectopic pacemaking, circumferential slow-wave propagation occurred, and was faster than normal longitudinal conduction (10.7 ± 6.2 SD vs 3.3 ± 1.5 SD mm s−1; P<0.001), with higher amplitudes (270 ± 155 SD vs 80 ± 40 SD μV; P<0.001). The time stamps are marked relative to the animations. F. A further example of propagation patterns during bradygastric activity, mapped at the corpus-antrum border, in idiopathic gastroparesis (ID#9). Normal activity (frequency 2.9 ± 0.1 SD c/min); e.g. wave (iii), was followed by a period of unstable ectopic focal events at a lower than normal frequency (2.2 ± 0.5 SD); waves (iv, v), which caused retrograde-propagating wavefronts that collided with proximal activities.
Figure 6
Figure 6
Abnormalities of slow-wave conduction. A. Position diagram (diabetic gastroparesis; ID#4), pertaining to (B,C). B. Isochronal maps (intervals = 1 s) and velocity maps of two consecutive wavefronts, demonstrating a marked, fixed reduction in corpus longitudinal conduction velocity in the distal field (<1 mm s−1). Animation Figure6i.wmv demonstrates how the reduced velocity caused wavefront crowding (wave-spacing <2 cm; normally 5-6 cm ); frequency = 3.5 ± 0.1 SD mm s−1. C. Position diagram (diabetic gastroparesis; ID#4), pertaining to (D-F). D. Isochronal maps (i-v) show representative wavefronts (intervals = 1 s; refer also animation Figure 6ii.wmv), with example electrograms shown in (E) (channel positions indicated in map (i). A series of abnormal initiation events repeatedly occurred in the lower half of the mapped field (waves i-iii). Further mapping (waves iii-v and animation) revealed a fixed area of marked reduction in corpus conduction velocity in the right mapped field (crowded isochrones), accompanied by intermittent conduction blocks (grey bars). Abnormal initiation occurred immediately distal to the region of aberrant conduction, and was often related to delayed excitation (Figure 6ii.wmv). F. Velocity maps are shown for waves (ii) and (v), demonstrating the rapid circumferential conduction during aberrant initiation (ii) and the markedly reduced longitudinal conduction velocity (<1 mm s−1) (v).

Comment in

References

    1. Kashyap P, Farrugia G. Diabetic gastroparesis: what we have learned and had to unlearn in the past 5 years. Gut. 2010;59:1716–1726. - PMC - PubMed
    1. Grover M, Farrugia G, Lurken MS, et al. Cellular changes in diabetic and idiopathic gastroparesis. Gastroenterology. 2011;140:1575–85. e8. - PMC - PubMed
    1. Faussone-Pellegrini MS, Grover M, Pasricha P, et al. Ultrastructural differences between diabetic and idiopathic gastroparesis: The NIDDK gastroparesis clinical research consortium (GpCRC) J Cell Mol Med. 2011 Ahead of Press. - PMC - PubMed
    1. Farrugia G. Interstitial cells of Cajal in health and disease. Neurogastroenterol Motil. 2008;20:54–63. - PubMed
    1. Ordog T. Interstitial cells of Cajal in diabetic gastroenteropathy. Neurogastroenterol Motil. 2008;20:8–18. - PubMed

Publication types