Comparative Study
. 2012 Oct;22(10):2153-60.
doi: 10.1007/s00330-012-2486-2. Epub 2012 May 30.

MR liver imaging with Gd-EOB-DTPA: a delay time of 10 minutes is sufficient for lesion characterisation

Affiliations
Comparative Study

MR liver imaging with Gd-EOB-DTPA: a delay time of 10 minutes is sufficient for lesion characterisation

C S van Kessel et al. Eur Radiol. 2012 Oct.

Abstract

Objectives: To assess whether, in patients with normal liver function, a hepatobiliary delay time of 10 min after Gd-EOB-DTPA injection is sufficient for lesion characterisation.

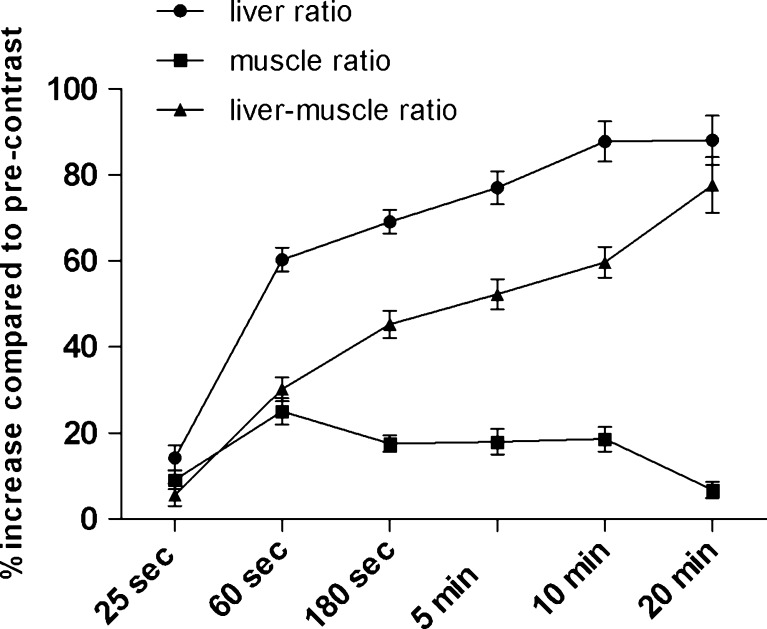
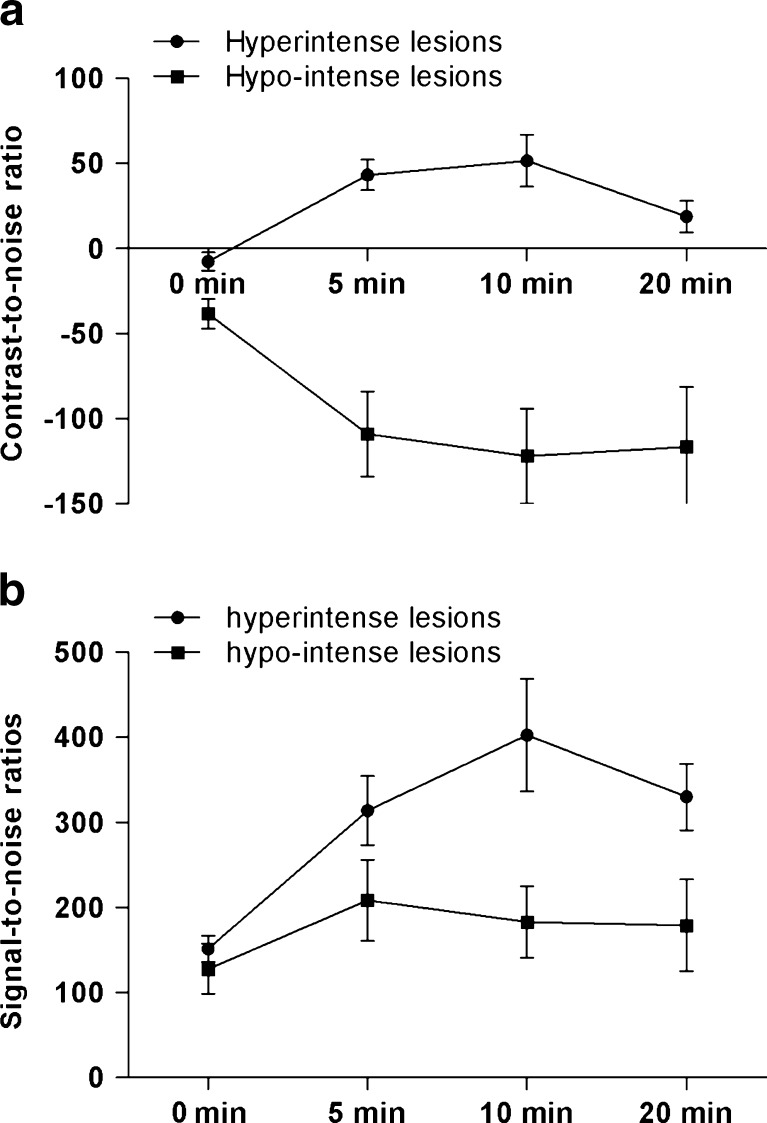
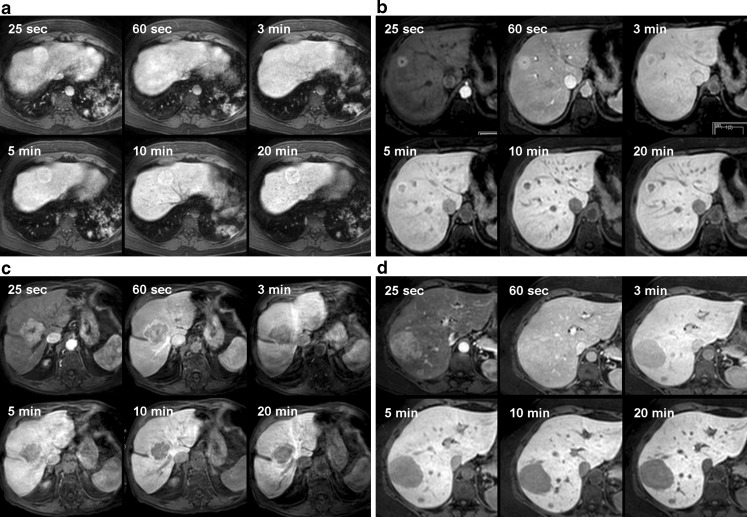
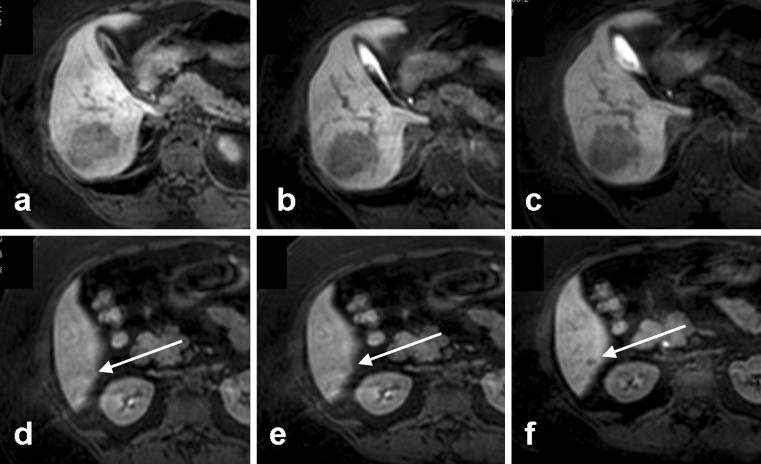
Methods: In 42 consecutive patients with suspected focal liver lesions, dynamic MRI was performed after intravenous Gd-EOB-DTPA, followed by hepatobiliary phases at 5, 10 and 20 min. The following items were assessed at each hepatobiliary phase: parenchymal enhancement, contrast agent excretion in bile ducts, lesion enhancement characteristics (hypo-, iso-, or hyperintensity, rim enhancement, central non-enhancement), and contrast- and signal-to-noise ratios, separately for hypo- and hyperintense lesions.

Results: Following enhancement, parenchymal signal intensity increased significantly up to 10 min (86.3%, P < 0.001), and subsequently stabilised (86.5% after 20 min, P = 0.223). Biliary contrast agent excretion was first observed in 2, 32 and 5 patients after 5, 10 and 20 min respectively. Hepatobiliary lesion enhancement characteristics observed after 5 min persisted during later hepatobiliary phases. CNR and SNR ratios increased significantly (P < 0.05) up to 10 min after enhancement without further increase at 20 min, in hypo- and hyperintense lesions.

Conclusions: If lesion characterisation is the primary reason for performing MRI, a hepatobiliary delay time of 10 min after Gd-EOB-DTPA injection is sufficient in patients with normal liver function.

Key points: • Magnetic resonance imaging is now a first line of investigation of the liver. • Optimal CNR and SNR are achieved 10 min after Gd-EOB-DTPA injection. • Typical enhancement characteristics are observed early and do not change. • Ten-minute hepatobiliary delay is sufficient for characterisation of focal liver lesions.


Figures

Fig. 1
Fig. 1
Mean (±SE) relative increase in signal intensities over time compared with the pre-contrast imaging. Results are displayed for the liver, the muscle and the liver-muscle ratios
Fig. 2
Fig. 2
a Mean contrast-to-noise ratios with standard error of the mean at 5, 10 and 20 min compared with the pre-contrast images. b Mean signal-to-noise ratios with standard error of the mean at 5, 10 and 20 min compared with the pre-contrast images
Fig. 3
Fig. 3
a-d Various enhancement patterns of solid hypervascular lesions during early dynamic phases and hepatobiliary phases (25 and 60 s; 3, 5, 10 and 20 min). a A 48-year-old man received an MRI with Gd-EOB-DTPA after he presented with an incidental lesion on ultrasound. The MRI shows a lesion in segments 4 and 8 of the liver, demonstrating the classic pattern of a focal nodular hyperplasia: hyperintense in the arterial phase, isointense in the portal phase, followed by a hyperintense appearance due to accumulation of contrast agent from 3 min onward, persisting into the later hepatobiliary phases. Furthermore, central linear non-enhancing structures in the hepatobiliary phases represent a central scar. The lesion remained stable in size during a 1.5-year follow-up. b A 59-year-old woman underwent abdominal CT during follow-up of a colorectal carcinoma. The lesion in segment 8 showed the following characteristics on MRI with Gd-EOB-DTPA: hyperintense on the arterial and portal phases with central hypointensity. After 3 min the central hypointense area enlarges, surrounded by a suggestion of contrast agent accumulation at the periphery of the lesion. During the later hepatobiliary phases the lesion centre becomes more hypointense compared with the liver parenchyma, and now unequivocal contrast agent accumulation at the periphery of the lesion is observed. These characteristics can occur in an atypical focal nodular hyperplasia (FNH) [10]. However, this patient had a history of malignancy and was therefore scheduled for surgery. Histopathology revealed FNH. c A 78-year-old man presented with the diagnosis of FNH based on a previous CT. A Gd-EOB-DTPA MRI was performed, showing a hypervascular lesion, with a central, non-enhancing cleft during the arterial phase, suggestive of a scar. During the portal phase, the central cleft remains, whilst the larger portion of the lesion is hypointense relative to surrounding parenchyma signifying wash-out. There is no contrast agent uptake during the subsequent hepatobiliary phases. As wash-out and non-accumulation in the late phases are atypical of FNH, a biopsy was performed. Histopathology revealed a well-differentiated hepatocellular carcinoma. d A 41-year-old woman presented with abdominal pain. Ultrasound revealed two large lesions in the right hemi-liver, and an MRI with Gd-EOB-DTPA was performed. The lesions are hyperintense on the arterial phase, iso-intense on the portal phase and homogeneously hypointense during all hepatobiliary phases. Thus, there is no contrast agent accumulation, and there are no signs of a central scar. This is an atypical finding, consistent with a hepatocellular adenoma or hepatocellular carcinoma. The patient underwent surgery, and histopathology revealed two hepatocellular adenomas
Fig. 4
Fig. 4
a-f In this patient, an additional lesion was detected at 20 min post-contrast injection. An adenoma in segment 6 is clearly visible at a 5, b 10 and c 20 min post-contrast injection. f An additional lesion was detected in segment 6 at 20 min post-contrast injection. In retrospective evaluation, with knowledge of the presence of this lesion at 20 min, a subtle hypointensity already reflects the presence of the lesion at d 5 and e 10 min

References

    1. Schima W, Saini S, Petersein J, et al. MR imaging of the liver with Gd-BOPTA: quantitative analysis of T1-weighted images at two different doses. J Magn Reson Imaging. 1999;10:80–83. doi: 10.1002/(SICI)1522-2586(199907)10:1<80::AID-JMRI11>3.0.CO;2-S. - DOI - PubMed
    1. Vogl TJ, Pegios W, McMahon C, et al. Gadobenate dimeglumine—a new contrast agent for MR imaging: preliminary evaluation in healthy volunteers. AJR Am J Roentgenol. 1992;158:887–892. - PubMed
    1. Reimer P, Rummeny EJ, Shamsi K, et al. Phase II clinical evaluation of Gd-EOB-DTPA: dose, safety aspects, and pulse sequence. Radiology. 1996;199:177–183. - PubMed
    1. Reimer P, Vosshenrich R. Detection and characterization of liver lesions using gadoxetic acid as a tissue-specific contrast agent. Biologics. 2010;4:199–212. - PMC - PubMed
    1. Hammerstingl R, Huppertz A, Breuer J, et al. Diagnostic efficacy of gadoxetic acid (Primovist)-enhanced MRI and spiral CT for a therapeutic strategy: comparison with intraoperative and histopathologic findings in focal liver lesions. Eur Radiol. 2008;18:457–467. doi: 10.1007/s00330-007-0716-9. - DOI - PubMed

Publication types