. 2012 Jul 3;109(27):E1848-57.
doi: 10.1073/pnas.1200250109. Epub 2012 May 29.

Robust cardiomyocyte differentiation from human pluripotent stem cells via temporal modulation of canonical Wnt signaling

Affiliations

Robust cardiomyocyte differentiation from human pluripotent stem cells via temporal modulation of canonical Wnt signaling

Xiaojun Lian et al. Proc Natl Acad Sci U S A. .

Abstract

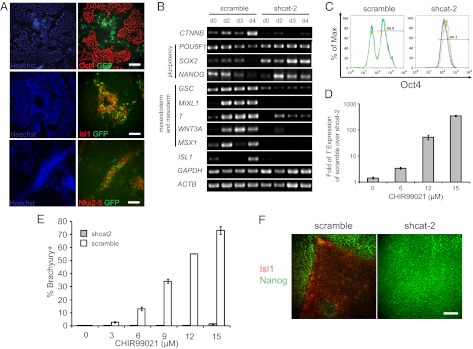
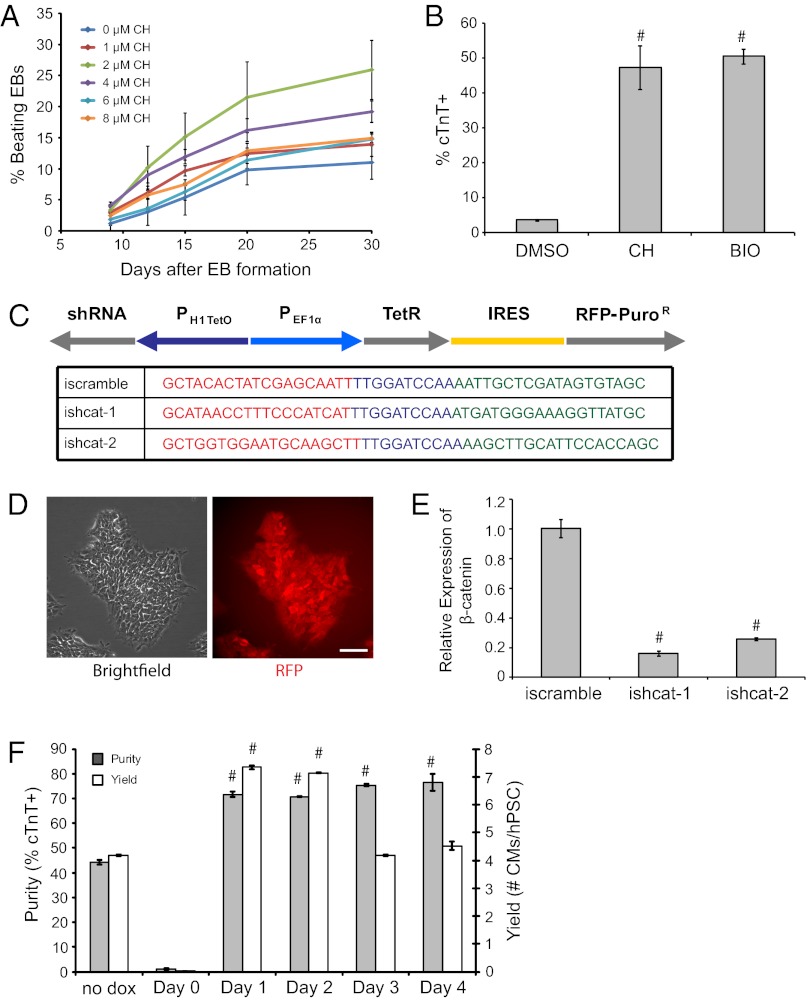
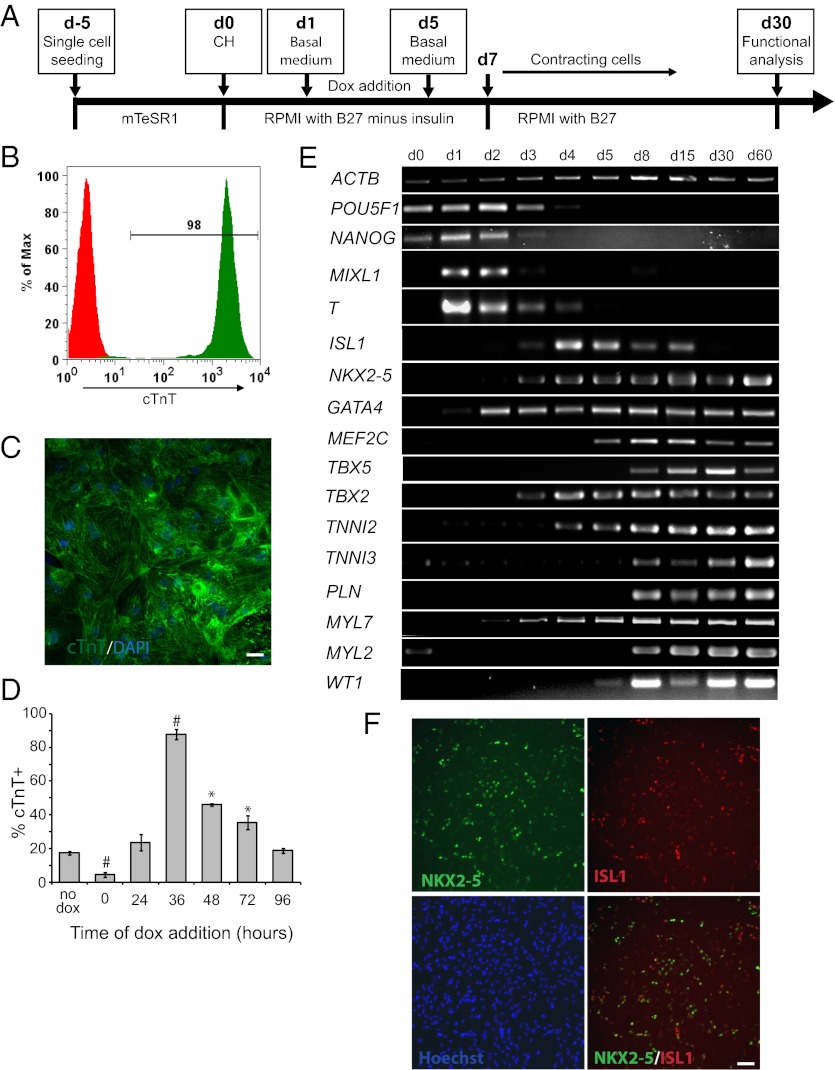
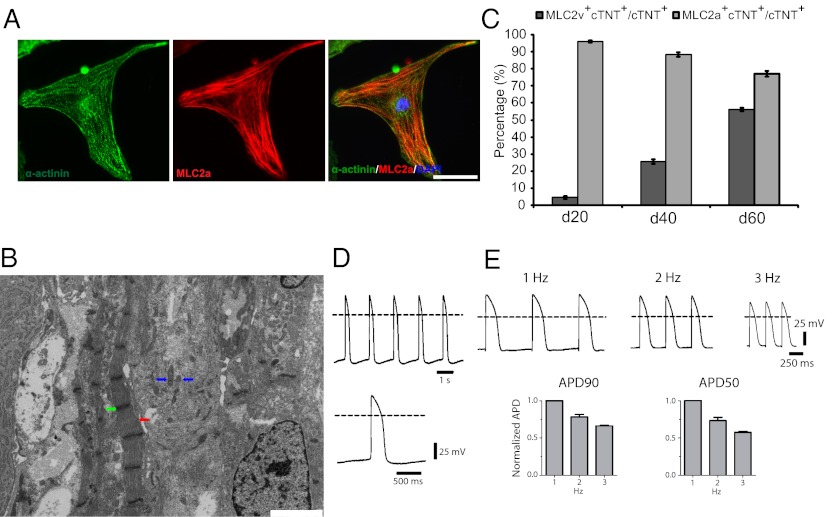
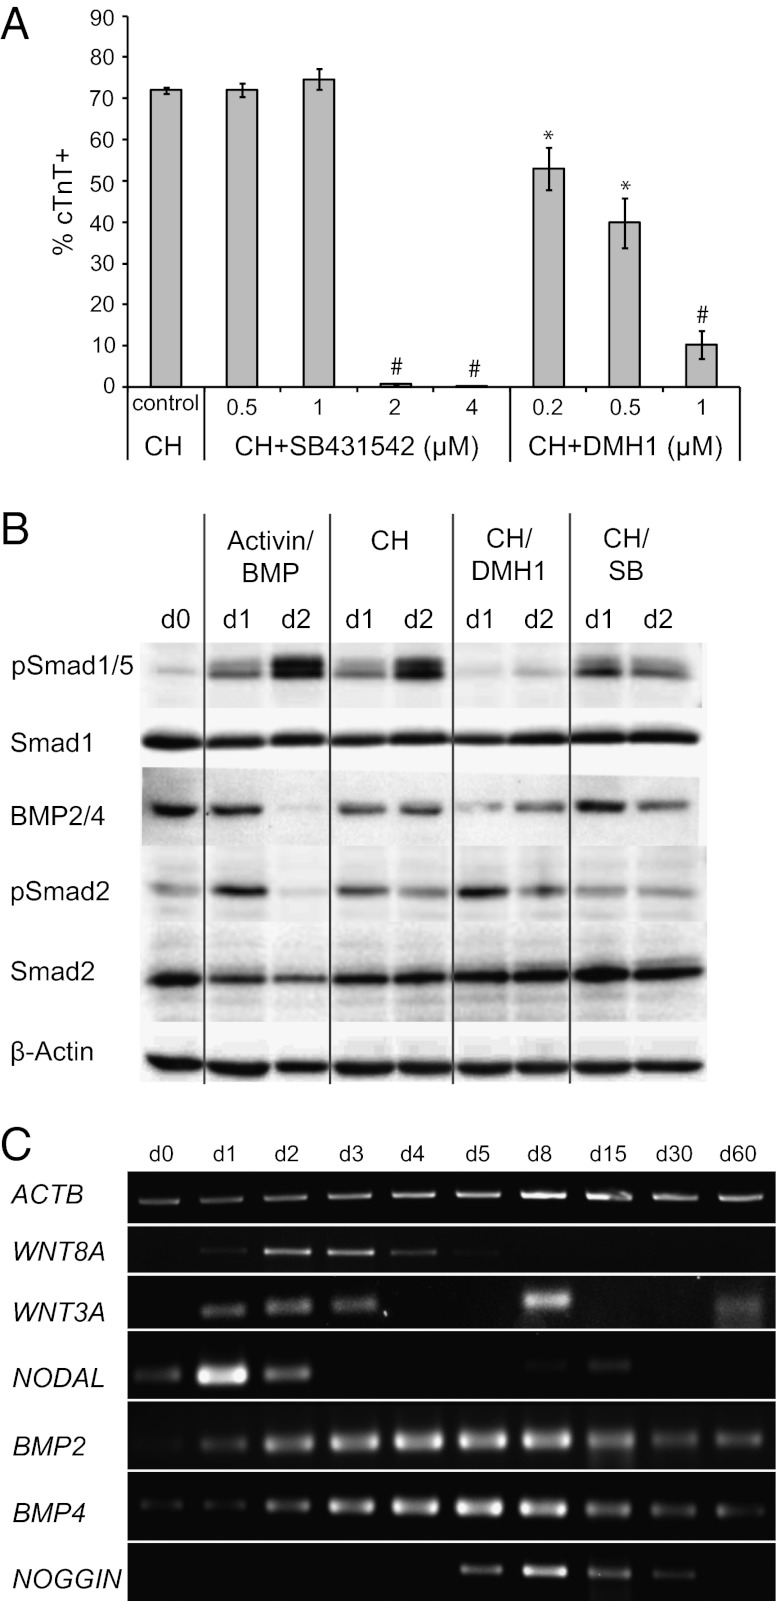
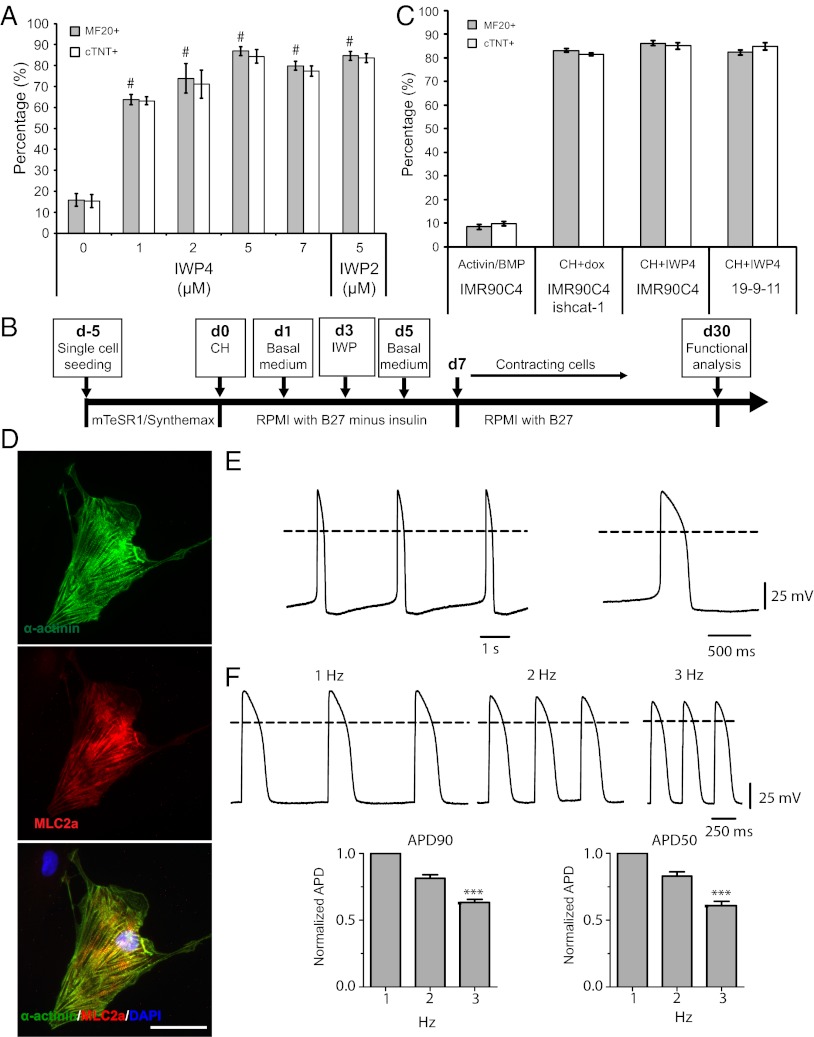
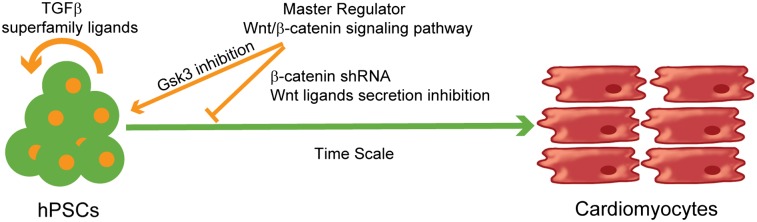
Human pluripotent stem cells (hPSCs) offer the potential to generate large numbers of functional cardiomyocytes from clonal and patient-specific cell sources. Here we show that temporal modulation of Wnt signaling is both essential and sufficient for efficient cardiac induction in hPSCs under defined, growth factor-free conditions. shRNA knockdown of β-catenin during the initial stage of hPSC differentiation fully blocked cardiomyocyte specification, whereas glycogen synthase kinase 3 inhibition at this point enhanced cardiomyocyte generation. Furthermore, sequential treatment of hPSCs with glycogen synthase kinase 3 inhibitors followed by inducible expression of β-catenin shRNA or chemical inhibitors of Wnt signaling produced a high yield of virtually (up to 98%) pure functional human cardiomyocytes from multiple hPSC lines. The robust ability to generate functional cardiomyocytes under defined, growth factor-free conditions solely by genetic or chemically mediated manipulation of a single developmental pathway should facilitate scalable production of cardiac cells suitable for research and regenerative applications.


Conflict of interest statement

Conflict of interest statement: T.J.K. is a founder and consultant for Cellular Dynamics International, a company that uses human stem cells for drug testing.

Figures

Fig. 1.
Fig. 1.
Differentiation induced by treatment with the Gsk3 inhibitor in hPSCs is β-catenin dependent. (A) H9-7TGP cells were treated with 12 μM CH in mTeSR1 for 4 d. Immunofluorescent staining for Oct4, Isl1, and Nkx2.5 was compared with GFP expression. (Scale bars, 50 μm.) (B and C) 19-9-11 shcat-2 and scramble cells were cultured on Matrigel with mTeSR1 medium containing 12 μM CH for 4 d. (B) RT-PCR analysis of pluripotent, mesendoderm, early mesoderm, and early cardiac gene expression was performed. (C) Oct4 expression on day 4 was analyzed by flow cytometry. Each colored line represents an independent replicate. n = 3. (D) 19-9-11 shcat-2 and scramble lines were cultured on Matrigel in mTeSR1 containing CH. After 2 d, the expression of T in the scramble relative to its expression in the shcat-2 line was quantified by quantitative PCR. (E) Flow cytometry analysis of brachyury expression in 19-9-11 shcat-2 and scramble cells exposed to CH for 4 d. Error bars represent SEM of three independent replicates. (F) 19-9-11 shcat-2 and scramble lines were cultured on Matrigel in mTeSR1 containing 12 μM CH. After 4 d, cells were immunostained for Nanog and Isl1. (Scale bar, 50 μm.)
Fig. 2.
Fig. 2.
Temporal regulation of Wnt/β-catenin signaling promotes cardiac differentiation induced by serum or growth factors. (A) H9 cells on MEFs were treated with CH in hESC medium for 3 d before forming EBs. EBs were cultured in suspension using serum containing medium for 4 d before being transferred to 0.1% (wt/vol) gelatin-coated plates. The percentage of contracting EBs was determined visually. (B) H9 cells were cultured on Matrigel and treated with DMSO, 1 μM CH, or 1 μM BIO for 3 d before exposure to 100 ng/mL activin A at day 0 and 5 ng/mL BMP4 at day 1 in RPMI/B27-insulin medium using monolayer-directed differentiation. At day 15, the percentage of cTnT+ cells in culture was assessed by flow cytometry. #P < 0.005, CH versus DMSO or BIO versus DMSO; Student’s t test. (C) Schematic of the inducible shRNA construct for β-catenin knockdown and shRNA sequences targeting β-catenin. PH1TetO represents the human H1 promoter with Tet operator sequences. Red and green sequences are forward and reverse shRNA sequences of β-catenin, respectively; the loop sequence is shown in blue. (D) Representative phase-contrast and mCherry epifluorescence images of 19-9-11 cells transduced with lentiviral vectors containing the constructs described in C and selected by puromycin treatment. (E) 19-9-11 ishcat-1 and ishcat-2 cells were cultured in mTeSR1 containing 2 μg/mL dox. After 3 d, mRNA was collected, and β-catenin expression was evaluated by quantitative PCR. Error bars represent SEM of three samples. #P < 0.005, ishcat-1 versus iscramble or ishcat-2 versus iscramble; Student’s t test. (F) 19-9-11 ishcat-1 cells were cultured in mTeSR1 medium and were treated with BIO before exposure to 100 ng/mL activin A at day 0 and 5 ng/mL BMP4 at day 1, with 2 μg/mL dox added at the indicated times. Cells were analyzed for cTnT expression by flow cytometry 15 d after initiation of differentiation. Error bars represent SEM. of three independent experiments. #P < 0.005, for each time point versus no dox; Student’s t test.
Fig. 3.
Fig. 3.
Modulating regulatory elements of Wnt signaling is sufficient for efficient and reproducible generation of human cardiomyocytes in the absence of growth factors. (A) Schematic of protocol for defined, growth factor-free differentiation of hPSCs expressing dox-inducible β-catenin shRNA to cardiomyocytes via treatment with small molecules. (B and C) 19-9-11 ishcat-1 cells were cultured as indicated in A with dox added 36 h after treatment with 12 μM CH. At day 15, cells were analyzed for cTnT expression by flow cytometry (B) or immunofluorescence (C). In B, the green histogram represents cTnT expression, and the red histogram is an isotype control. (Scale bar in C, 50 μm.) (D) 19-9-11 ishcat-2 cells were cultured as indicated in A, with dox added at different time points after treatment with 12 μM CH. At day 15, cells were analyzed for cTnT expression by flow cytometry. Error bars represent SEM of three independent experiments. *P < 0.05 and #P < 0.005, each time point versus no dox; Student’s t test. (E and F) 19-9-11 ishcat-1 cells were differentiated as described in A, with dox added 36 h after treatment with 12 μM CH. (E) At different time points, mRNA was collected, and RT-PCR analysis of pluripotent, mesendoderm, mesoderm, and cardiac gene expression was performed. (F) Day 7 cells were analyzed for Isl1 and Nkx2.5 expression by immunofluorescence. (Scale bar, 100 μm.)
Fig. 4.
Fig. 4.
Structural and functional characterization of cardiomyocytes generated from hPSCs via modulation of Wnt signaling. (A) Cardiomyocytes were generated from 19-9-11 ishcat-1 cells using the protocol described in Fig. 3A, with treatment with 12 μM CH at day 0 and 2 μg/mL dox 36 h later. At day 30, cells were individualized and replated on 0.1% (wt/vol) gelatin-coated coverslips. Immunostaining for α-actinin and MLC2a shows sarcomere organization. (Scale bar, 50 μm.) (B) Transmission electron microscopic images of beating clusters derived from the 19-9-11 ishcat-1 line as described in A shows myofibrils (red arrow) with Z-bands (green arrow) and mitochondria (blue arrows). (Scale bar, 2 μm.) (C) 19-9-11 ishcat-1 cells were differentiated as described in Fig. 3A, with 12 μM CH added at day 0 and 2 μg/mL dox added 36 h later. Cells were assayed for cTNT, MLC2v, and MLC2a by flow cytometry at the indicated time points. Error bars represent the SEM of three independent experiments. Day 20, day 40, and day 60 are significantly different from each other (P < 0.05) when compared using one-way ANOVA and Tukey post hoc tests. (D) Microelectrode recordings of action potential activity were collected at day 29 in cardiomyocytes derived from the 19-9-11 ishcat-1 cells differentiated as described in A. Dashed lines indicate 0 mV. (E) (Upper) Representative recordings of action potentials collected during field stimulation at 1, 2, and 3 Hz as indicated. (Lower) Bar graphs showing average (± SEM) fractional changes in action potential duration at 90% (APD90) and 50% (APD50) repolarization obtained by normalizing to the values observed in response to 1-Hz stimulation. Data represent SEM of four independent experiments.
Fig. 5.
Fig. 5.
Induction of TGF-β superfamily signaling by treatment with a Gsk3 inhibitor. (A) 19-9-11 ishcat-2 cells were treated with 12 μM CH, 12 μM CH plus 0.5–4 μM SB, or 12 μM CH plus 0.2–1 μM DMH1 for 24 h. All samples were treated with 2 μg/mL dox 48 h later. At day 15, the percentage of cTnT+ cells was assessed by flow cytometry. Error bars represent SEM of three independent experiments. *P < 0.05; #P < 0.005, each point versus control; Student’s t test. (B) Expression of BMP2/4 and expression and phosphorylation of Smad proteins were analyzed via Western blot in 19-9-11 ishcat-2 cells undergoing differentiation by 100 ng/mL activin A at day 0 and 5 ng/mL BMP4 at day 1 or treatment with 12 μM CH, 12 μM CH plus 1 μM DMH1, or 12 μM CH plus 1 μM SB for 24 h followed by the addition of 2 μg/mL dox at 36 h. (C) 19-9-11 ishcat-2 cells were differentiated to cardiomyocytes, as shown in Fig. 3A, with 12 μM CH treatment at day 0 and the addition of 2 μg/mL dox at 36 h. At different time points, Wnt and TGF-β pathway gene expression was assessed by RT-PCR.
Fig. 6.
Fig. 6.
Development of a protocol for differentiation of hPSCs to cardiomyocytes in fully defined conditions via small molecule modulation of regulatory elements of Wnt signaling. (A) 19-9-11 cells were cultured on Matrigel in mTeSR1 for 5 d before exposure to 12 μM CH at day 0 and 0–7 μM IWP4 or 5 μM IWP2 at day 3 in RPMI/B27-insulin. At day 15, cTnT expression and MF20 staining were assessed by flow cytometry. Error bars represent SEM of three independent experiments. #P < 0.005, each point versus no drug; Student’s t test. (B) Schematic of protocol for fully defined, growth factor-free differentiation of hPSCs to cardiomyocytes via treatment with small molecules. (C) IMR90C4 and 19-9-11 cells were cultured on Synthemax plates in mTeSR1 for 5 d before exposure to 12 μM CH at day 0 and 5 μM IWP4 at day 3 in RPMI/B27-insulin. IMR90C4 cells were differentiated with 100 ng/mL activin A at day 0 and 5 ng/mL BMP4 at day1 as a control. At day 15, cTNT and MF20 expression were assessed by flow cytometry. Error bars represent SEM of three independent experiments. (D) Cardiomyocytes were generated from 19-9-11 cells using the protocol described in C, with 12 μM CH treatment at day 0 and 5 μM IWP4 treatment 3 d later on Synthemax plates. At day 30, cells were individualized and replated on 0.1% (wt/vol) gelatin-coated coverslips. Immunostaining for α-actinin and MLC2a shows sarcomere organization. (Scale bar, 50 μm.) (E) (Left) Microelectrode recordings of action potential activity were collected at day 29 in cardiomyocytes derived from the 19-9-11 cells differentiated as described in C. (Right) Single action potential taken from the start of the recording shown at an expanded timescale. Dashed lines indicate 0 mV. (F) (Upper) Representative recording of action potentials from a cardiomyocyte derived from the 19-9-11 line during field stimulation at 1, 2, and 3 Hz as indicated. Dashed lines indicate 0 mV. (Lower) Bar graphs showing average (± SEM) fractional changes in action potential duration at 90% and 50% repolarization obtained by normalizing to the values observed in response to 1 Hz stimulation (n = 6) for cardiomyocytes exhibiting a ventricular-like action potential phenotype. A nonparametric Kruskal–Wallis test and Dunn’s posttest were used for statistical comparisons of rate adaptation. ***P < 0.001.
Fig. P1.
Fig. P1.
Differentiation of hPSCs to cardiomyocytes via small-molecule modulation of regulatory elements of canonical Wnt signaling. GSK-3 inhibition stimulates mesoderm commitment of undifferentiated hPSCs. In the later stages of differentiation, expression of β-catenin shRNA or inhibition of Wnt ligand production stimulates cardiomyocyte differentiation.

References

    1. Thomson JA, et al. Embryonic stem cell lines derived from human blastocysts. Science. 1998;282:1145–1147. - PubMed
    1. Yu J, et al. Induced pluripotent stem cell lines derived from human somatic cells. Science. 2007;318:1917–1920. - PubMed
    1. Takahashi K, et al. Induction of pluripotent stem cells from adult human fibroblasts by defined factors. Cell. 2007;131:861–872. - PubMed
    1. Graichen R, et al. Enhanced cardiomyogenesis of human embryonic stem cells by a small molecular inhibitor of p38 MAPK. Differentiation. 2008;76:357–370. - PubMed
    1. Yang L, et al. Human cardiovascular progenitor cells develop from a KDR+ embryonic-stem-cell-derived population. Nature. 2008;453:524–528. - PubMed

Publication types

MeSH terms