. 2012 Jun 12;109(24):9557-62.
doi: 10.1073/pnas.1203517109. Epub 2012 May 29.

Heterogeneity in tuberculosis transmission and the role of geographic hotspots in propagating epidemics

Affiliations

Heterogeneity in tuberculosis transmission and the role of geographic hotspots in propagating epidemics

David W Dowdy et al. Proc Natl Acad Sci U S A. .

Abstract

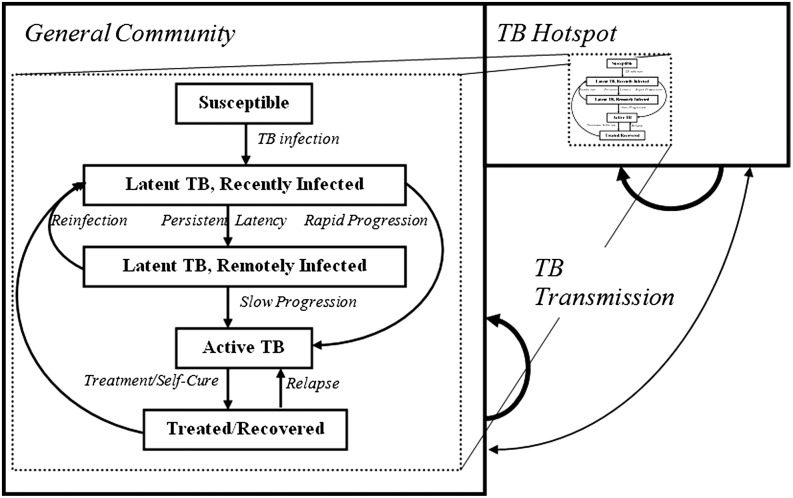
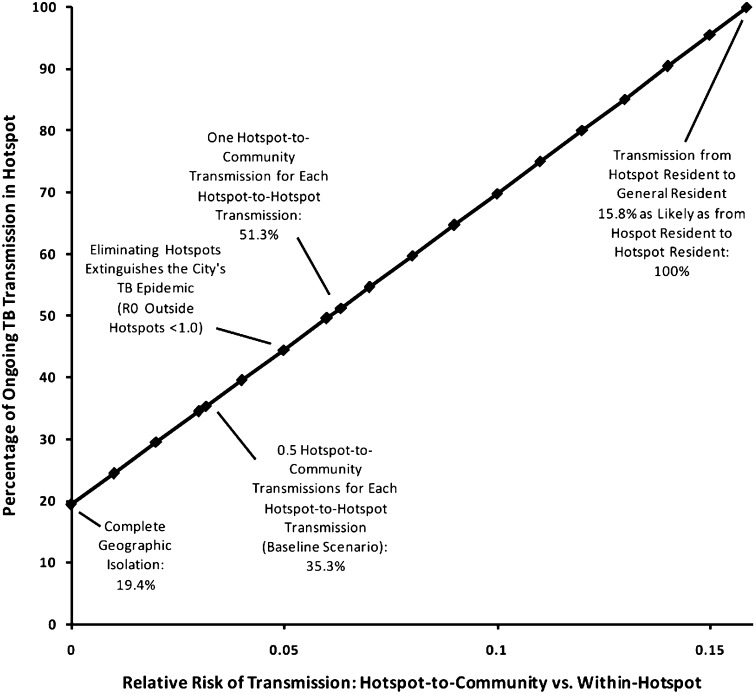
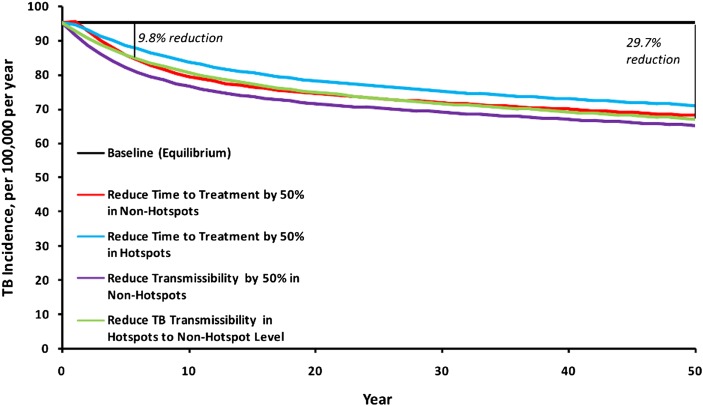
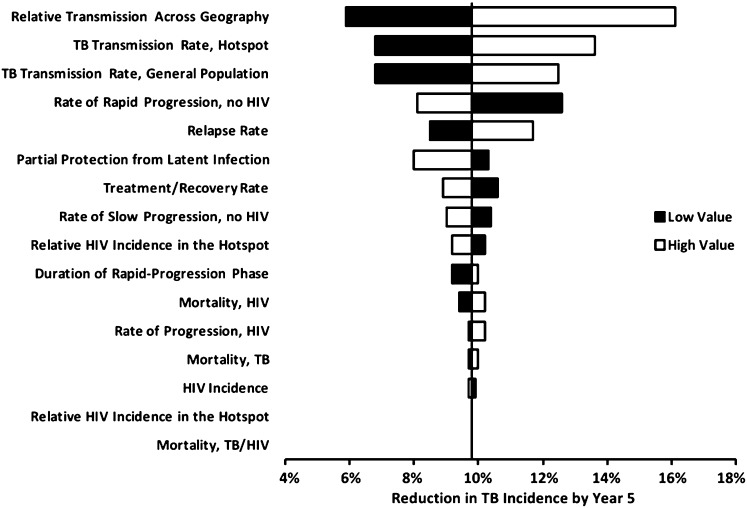
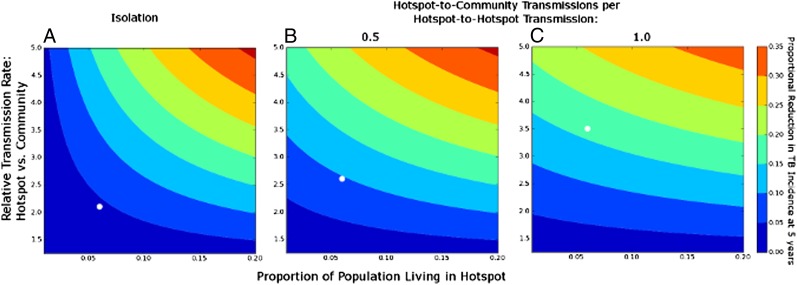
The importance of high-incidence "hotspots" to population-level tuberculosis (TB) incidence remains poorly understood. TB incidence varies widely across countries, but within smaller geographic areas (e.g., cities), TB transmission may be more homogeneous than other infectious diseases. We constructed a steady-state compartmental model of TB in Rio de Janeiro, replicating nine epidemiological variables (e.g., TB incidence) within 1% of their observed values. We estimated the proportion of TB transmission originating from a high-incidence hotspot (6.0% of the city's population, 16.5% of TB incidence) and the relative impact of TB control measures targeting the hotspot vs. the general community. If each case of active TB in the hotspot caused 0.5 secondary transmissions in the general community for each within-hotspot transmission, the 6.0% of people living in the hotspot accounted for 35.3% of city-wide TB transmission. Reducing the TB transmission rate (i.e., number of secondary infections per infectious case) in the hotspot to that in the general community reduced city-wide TB incidence by 9.8% in year 5, and 29.7% in year 50-an effect similar to halving time to diagnosis for the remaining 94% of the community. The importance of the hotspot to city-wide TB control depended strongly on the extent of TB transmission from the hotspot to the general community. High-incidence hotspots may play an important role in propagating TB epidemics. Achieving TB control targets in a hotspot containing 6% of a city's population can have similar impact on city-wide TB incidence as achieving the same targets throughout the remaining community.


Conflict of interest statement

The authors declare no conflict of interest.

Figures

Fig. 1.
Fig. 1.
Compartmental model of TB epidemic in Rio de Janeiro. The population is divided into two geographic compartments: the general population (94% of the total population) and a TB hotspot (6% of the total population, accounting for 16.5% of TB incidence). TB transmission occurs within and, to a lesser extent, across geographic compartments. In each geographic compartment, individuals fall into one of five TB states. Not shown here, but also included in the model, are two HIV states (HIV infected and uninfected), with HIV prevalence also higher in the hotspot. Each geographic compartment has its own births and deaths; for simplicity, migration between compartments is not explicitly modeled, but can be conceptualized as one mechanism of cross-compartment infection.
Fig. 2.
Fig. 2.
Proportion of TB transmission events in Rio de Janeiro arising from cases in the hotspot. The x axis describes the relative risk of transmission from an active TB case in the hotspot to a randomly selected resident of the general population, compared with a random hotspot resident. Because the general population is 0.94/0.06 = 15.7× larger than the hotspot, a relative transmission risk of 1/15.7 = 0.064 assumes that a TB case in the hotspot generates as many secondary transmissions in the general population as in the hotspot. The baseline scenario in the text assumes one-half this rate of cross-transmission (i.e., two hotspot-to-hotspot transmissions for every hotspot-to-community transmission). Under this assumption, the hotspot generated 35.3% of all transmission events, compared with 19.4% if cross-transmission were disallowed.
Fig. 3.
Fig. 3.
Impact on TB incidence of hotspot-focused vs. population-based interventions. The upper solid line reflects the equilibrium assumption used to fit the model, in the absence of any intervention. The light blue and red lines correspond to 50% reductions in the mean infectious period (e.g., through active case-finding or improved diagnosis) of cases residing in the hotspot and general community, respectively. The purple line shows a reduction of 50% in the transmission rate of TB cases (i.e., number of secondary infections per infectious person-year) residing outside the hotspot. By comparison, the green line shows “normalization” of the hotspot (reduction in TB transmission per infectious hotspot person-year to the mean level in the general population). This scenario generates a mean 2.0% annual reduction in TB incidence per year over the first 5 y, or 9.8% reduction in TB incidence by the end of year 5 (29.7% by year 50). In general, interventions targeting the 6% of people living in the hotspot have similar impact to interventions targeting the remaining 94% of the population.
Fig. 4.
Fig. 4.
One-way sensitivity analysis showing the reduction in transmission at year 5 from eliminating hotspots. Values on the x axis represent the relative reduction in city-wide TB incidence achieved at the end of year 5 after normalizing the hotspot (see text and Fig. 3, green line). Relative transmission across geography is varied from 0.01 to 0.063 (one hotspot-to-community transmission for each hotspot-to-hotspot transmission; Fig. 2); other parameters are varied to produce a 25% change in the corresponding epidemiological parameter (Table 1). The top three parameters were subsequently varied in multiway sensitivity analysis that also included hotspot size (Fig. 5), whereas the remaining parameters were simultaneously varied in best-case and worst-case uncertainty analysis (see text for more information).
Fig. 5.
Fig. 5.
Projected reduction in city-wide TB incidence after normalizing hotspots, according to size and intensity of hotspot. Values of contour lines show the proportional reduction in city-wide TB incidence at the end of year 5 achieved by lowering TB transmission in hotspots to the mean value in the rest of the city (Fig. 3, green line). Box A assumes complete geographic isolation of the hotspot (i.e., no cross-transmission from hotspot to community), box B assumes 0.5 transmission events from hotspot to community for every hotspot-to-hotspot transmission, and box C assumes one hotspot-to-community transmission for every hotspot-to-hotspot transmission. The baseline scenario in the text corresponds to box B, with a relative transmission rate of 2.6 and hotspot size of 0.06 (9.8% reduction). Other scenarios that replicate the TB incidence seen in Rio de Janeiro hotspots are a relative transmission rate of 2.1 in box A (4.3% reduction) and 3.5 in box C (16.3% reduction). These scenarios are shown with open circles.

References

    1. World Health Organization . Global Tuberculosis Control: WHO Report 2011. Geneva: WHO; 2011.
    1. Munch Z, et al. Tuberculosis transmission patterns in a high-incidence area: A spatial analysis. Int J Tuberc Lung Dis. 2003;7:271–277. - PubMed
    1. Spence DP, Hotchkiss J, Williams CS, Davies PD. Tuberculosis and poverty. BMJ. 1993;307:759–761. - PMC - PubMed
    1. Chaisson RE, Martinson NA. Tuberculosis in Africa—combating an HIV-driven crisis. N Engl J Med. 2008;358:1089–1092. - PubMed
    1. Lönnroth K, Jaramillo E, Williams BG, Dye C, Raviglione M. Drivers of tuberculosis epidemics: The role of risk factors and social determinants. Soc Sci Med. 2009;68:2240–2246. - PubMed

Publication types