. 2012 Feb 28:3:29.
doi: 10.3389/fendo.2012.00029. eCollection 2012.

Variability in the heritability of body mass index: a systematic review and meta-regression

Affiliations

Variability in the heritability of body mass index: a systematic review and meta-regression

Cathy E Elks et al. Front Endocrinol (Lausanne). .

Abstract

Evidence for a major role of genetic factors in the determination of body mass index (BMI) comes from studies of related individuals. Despite consistent evidence for a heritable component of BMI, estimates of BMI heritability vary widely between studies and the reasons for this remain unclear. While some variation is natural due to differences between populations and settings, study design factors may also explain some of the heterogeneity. We performed a systematic review that identified 88 independent estimates of BMI heritability from twin studies (total 140,525 twins) and 27 estimates from family studies (42,968 family members). BMI heritability estimates from twin studies ranged from 0.47 to 0.90 (5th/50th/95th centiles: 0.58/0.75/0.87) and were generally higher than those from family studies (range: 0.24-0.81; 5th/50th/95th centiles: 0.25/0.46/0.68). Meta-regression of the results from twin studies showed that BMI heritability estimates were 0.07 (P = 0.001) higher in children than in adults; estimates increased with mean age among childhood studies (+0.012/year, P = 0.002), but decreased with mean age in adult studies (-0.002/year, P = 0.002). Heritability estimates derived from AE twin models (which assume no contribution of shared environment) were 0.12 higher than those from ACE models (P < 0.001), whilst lower estimates were associated with self reported versus DNA-based determination of zygosity (-0.04, P = 0.02), and with self reported versus measured BMI (-0.05, P = 0.03). Although the observed differences in heritability according to aspects of study design are relatively small, together, the above factors explained 47% of the heterogeneity in estimates of BMI heritability from twin studies. In summary, while some variation in BMI heritability is expected due to population-level differences, study design factors explained nearly half the heterogeneity reported in twin studies. The genetic contribution to BMI appears to vary with age and may have a greater influence during childhood than adult life.

Keywords: body mass index; family study; heritability; twin study.


Figures

Figure 1
Figure 1
Histogram showing the wide distribution of reported estimates of BMI heritability from twin studies (white bars) and family studies (gray bars).
Figure 2
Figure 2
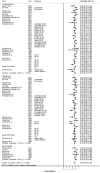
Meta-analysis of BMI heritability estimates in twin studies. The forest plot shows the results of a random effects meta-analysis of 88 independent BMI heritability estimates from 31 papers.
Figure 3
Figure 3
Predicted BMI heritability by age. The dotted line represents predicted BMI heritability by age, modeled using piecewise linear splines with a knot point at age 18 to separate childhood and adulthood. The figure shows that the relative contribution of genetic factors to variation in BMI increases over childhood before declining during adult life. Each circle represents an individual estimate of BMI heritability, and the size of the circle is proportional to the inverse of the SE of the heritability estimate. Age is based on the mean age of the study sample, or the mid-point of the age range where this was not reported.
Figure 4
Figure 4
Meta-analysis of BMI heritability estimates in family studies. The forest plot shows the results of a random effects meta-analysis of 27 independent BMI heritability estimates from 25 papers.
Figure A1
Figure A1
Modeling heritability in twin studies. This diagram shows how twin studies can model variance components, based on the path diagram proposed by Neale and Cardon (1992). The lines adjoining variance components indicate the degree of correlation (r), shown for both monozygotic (MZ) and dizygotic (DZ) twins. Additive genetic variance (A) is 100% correlated for MZ twin pairs and 50% correlated for DZ twin pairs. Common environment is shared (C) 100% by both types of twin. E represents a unique environmental component, and hence there is no correlation. Statistical modeling allows phenotypic variance to be quantitatively decomposed into A, C, and E subcomponents (the ACE model). The estimate of A gives a measure of the heritability of the trait. In a more parsimonious AE model, the C component would be missing from this diagram.
Figure A2
Figure A2
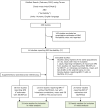
Flow chart of identification of relevant literature.

References

    1. Abney M., Mcpeek M. S., Ober C. (2001). Broad and narrow heritabilities of quantitative traits in a founder population. Am. J. Hum. Genet. 68, 1302–130710.1086/320112 - DOI - PMC - PubMed
    1. Allison D. B., Heshka S., Neale M. C., Lykken D. T., Heymsfield S. B. (1994). A genetic analysis of relative weight among 4,020 twin pairs, with an emphasis on sex effects. Health Psychol. 13, 362–36510.1037/0278-6133.13.4.362 - DOI - PubMed
    1. Almasy L., Blangero J. (1998). Multipoint quantitative-trait linkage analysis in general pedigrees. Am. J. Hum. Genet. 62, 1198–121110.1086/301844 - DOI - PMC - PubMed
    1. Andreasen C. H., Stender-Petersen K. L., Mogensen M. S., Torekov S. S., Wegner L., Andersen G., Nielsen A. L., Albrechtsen A., Borch-Johnsen K., Rasmussen S. S., Clausen J. O., Sandbaek A., Lauritzen T., Hansen L., Jorgensen T., Pedersen O., Hansen T. (2008). Low physical activity accentuates the effect of the FTO rs9939609 polymorphism on body fat accumulation. Diabetes 57, 95–10110.2337/db07-0910 - DOI - PubMed
    1. Arya R., Duggirala R., Comuzzie A. G., Puppala S., Modem S., Busi B. R., Crawford M. H. (2002). Heritability of anthropometric phenotypes in caste populations of Visakhapatnam, India. Hum. Biol. 74, 325–34410.1353/hub.2002.0026 - DOI - PubMed