. 2011 May 4:2:12.
doi: 10.3389/fpls.2011.00012. eCollection 2011.

Phenotype Uniformity in Combined-Stress Environments has a Different Genetic Architecture than in Single-Stress Treatments

Affiliations

Phenotype Uniformity in Combined-Stress Environments has a Different Genetic Architecture than in Single-Stress Treatments

G Buddhika Makumburage et al. Front Plant Sci. .

Abstract

For crop production it is desirable for the mapping between genotype and phenotype to be consistent, such that an optimized genotype produces uniform sets of individual plants. Uniformity is strongly selected in breeding programs, usually automatically, as harvest equipment eliminates severely non-uniform individuals. Uniformity is genetically controlled, is known to be increased by interplant competition, and is predicted to increase upon abiotic stress. We mapped maize loci controlling genotype by environment interaction in plant height uniformity. These loci are different than the loci controlling mean plant height. Uniformity decreases upon combining two abiotic stresses, with alleles conferring greater uniformity in a single stress showing little improvement in a combined stress treatment. The maize B73 and Mo17 inbreds do not provide segregating alleles for improvement in plant height uniformity, suggesting that the genetic network specifying plant height has a past history of selection for robustness.

Keywords: QTL; Zea mays L.; abiotic; combined stress; maize; multiple stress; phenotype stability; uniformity.


Figures

Figure 1
Figure 1
Schematic example of genetic control of uniformity. Three recombinant inbred lines for each parental type (B73 and Mo17) differing in a causal allele are shown on either side of the center line, with four plants of each genotype arranged vertically. The mean plant height is the same whether the B73 or Mo17 allele is present. However, the uniformity differs, with the B73 allele conferring low uniformity.
Figure 2
Figure 2
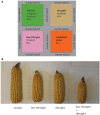
Experimental design and effect of field treatment blocks on hybrid maize. (A) Layout of field stress treatment blocks. Each field environment is color-coded, with control green, low N pink, drought tan, and combined low N and drought orange. (B) To illustrate the effect of the stress treatments one randomly chosen commercial hybrid ear from each treatment block is shown. Ear diameter, kernel number and ear length are affected by the stress treatments.
Figure 3
Figure 3
Additive Environmental Uniformity Effect Loci Allele effects for loci with significant genotype by environment interactions and measured combined-stress environment effects similar to effects predicted by simple addition of single-stress effects are shown. For each of the four field sectors (control, low nitrogen [N], drought, and low N plus drought) B73 allele effects are indicated in solid and Mo17 effects as hatched. Each field environment is color-coded, with control green, low N pink, drought tan, and combined low N and drought orange. Square root prediction error variance (equivalent to SE) bars are indicated for each estimate. Addition of effect size from low N and drought provides the predicted effect size at the bottom of each graph. Low allele effect numbers indicate more variation, as the X axis on each plot is – LMR. (A) Chromosome 2 locus, bin 2.06. (B) Chromosome 5.07/5.08 locus. (C) Chromosome 7 locus, bin 7.02. (D) Chromosome 7 locus, bin 7.02. (E) Chromosome 8 locus, bin 8.07/8.08. (F) Chromosome 9 locus, bin 9.06.
Figure 4
Figure 4
Non-additive Environmental Uniformity Effect Loci Allele effects for loci with significant genotype by environment interactions and measured two-stress environment effects different from effects predicted by simple addition of single-stress effects are shown. For each of the four field sectors (control, low nitrogen [N], drought, and low N plus drought) B73 allele effects are indicated in solid and Mo17 effects as hatched. Each field environment is color-coded, with control green, low N pink, drought tan, and combined low N and drought orange. Square root prediction error variance (equivalent to SE) bars are indicated for each estimate. Addition of effect size from low N and drought provides the predicted effect size at the bottom of each graph. Low allele effect numbers indicate more variation, as the X axis on each plot is – LMR. (A) Chromosome 3 locus, bin 3.01. (B) Chromosome 6 locus, bin 6.01/6.03. (C) Chromosome 7 locus, bin 7.01.

References

    1. Baker R. (1984). “Some of the open pollinated varieties that contributed the most to modern hybrid corn,” in Illinois Corn Breeders School. University of Illinois, Urbana, IL
    1. Balint-Kurti P., Simmons S. J., Blum J. E., Ballare C. L., Stapleton A. E. (2010). Maize leaf epiphytic bacteria diversity patterns are genetically correlated with resistance to fungal pathogen infection. Mol. Plant Microbe Interact. 23, 473–48410.1094/MPMI-23-4-0473 - DOI - PubMed
    1. Boomsma C. R., Santini J. B., West T. D., Brewer J. C., McIntyre L. M., Vyn T. J. (2010). Maize grain yield responses to plant height variability resulting from crop rotation and tillage system in a long-term experiment. Soil Tillage Res. 106, 227–24010.1016/j.still.2009.12.006 - DOI
    1. Cone K. C., McMullen M. D., Bi I. V., Davis G. L., Yim Y.-S., Gardiner J. M., Polacco M. L., Sanchez-Villeda H., Fang Z., Schroeder S. G., Havermann S. A., Bowers J. E., Paterson A. H., Soderlund C. A., Engler F. W., Wing R. A., Coe E. H. (2002). Genetic, physical, and informatics resources for maize. On the road to an integrated map. Plant Physiol. 130, 1598–160510.1104/pp.012245 - DOI - PMC - PubMed
    1. Des Marais D. L., Juenger T. E. (2010). Pleiotropy, plasticity, and the evolution of plant abiotic stress tolerance. Ann. N. Y. Acad. Sci. 1206, 56–7910.1111/j.1749-6632.2010.05703.x - DOI - PubMed