. 2012 Jan 13:3:1.
doi: 10.3389/fpls.2012.00001. eCollection 2012.

Protein Phylogenetic Analysis of Ca(2+)/cation Antiporters and Insights into their Evolution in Plants

Affiliations

Protein Phylogenetic Analysis of Ca(2+)/cation Antiporters and Insights into their Evolution in Plants

Laura Emery et al. Front Plant Sci. .

Abstract

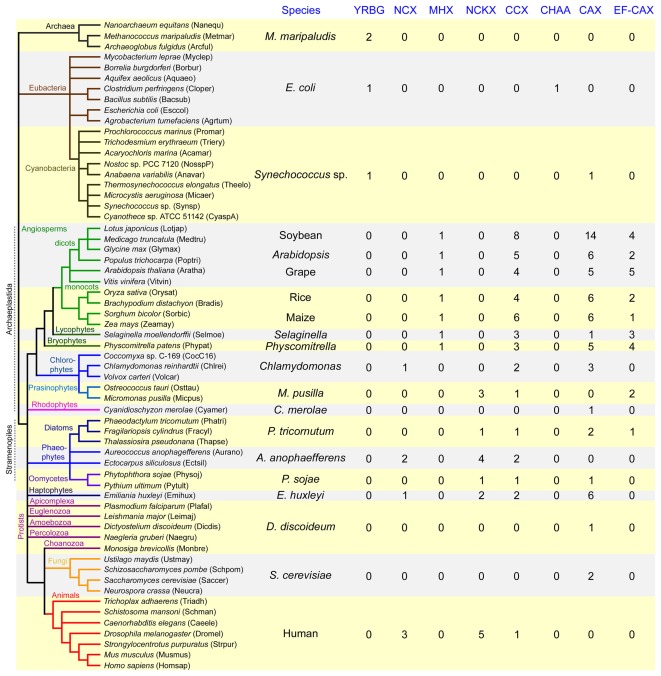
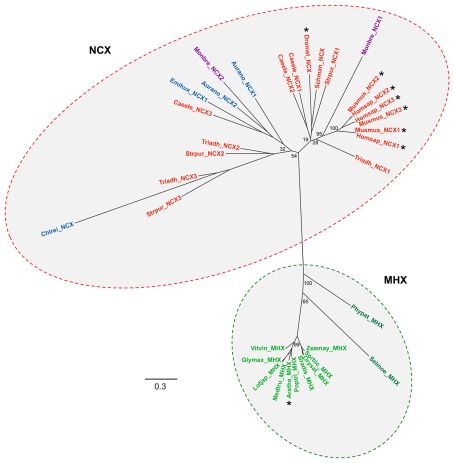
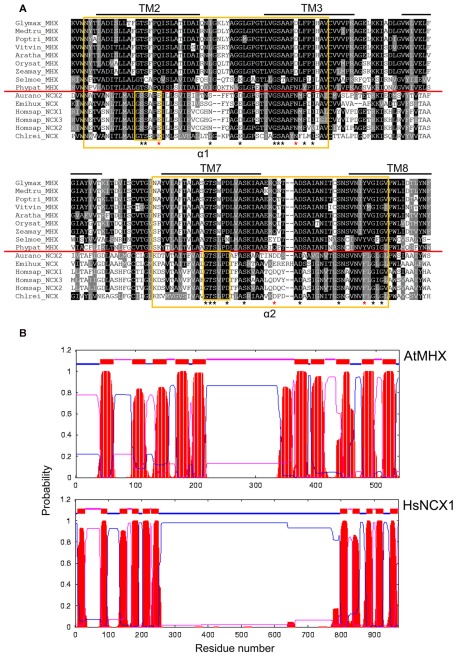
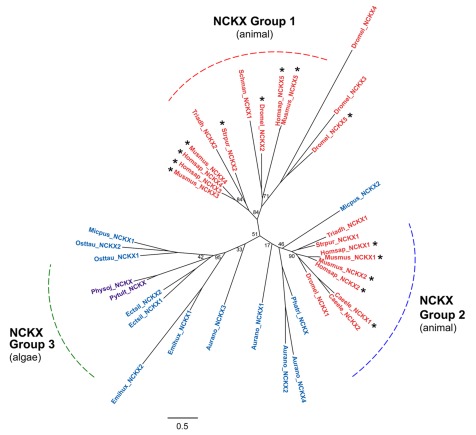
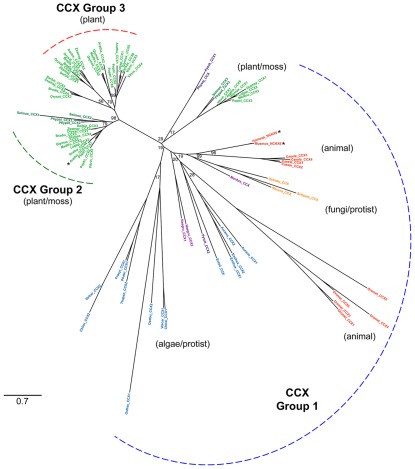
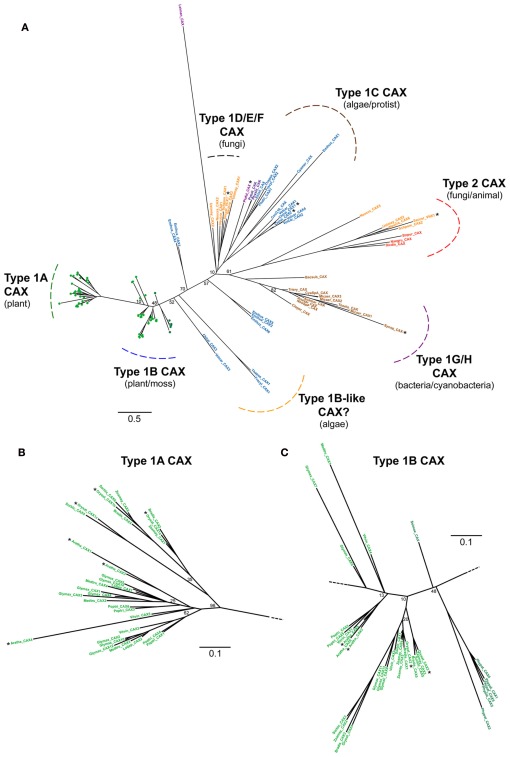
Cation transport is a critical process in all organisms and is essential for mineral nutrition, ion stress tolerance, and signal transduction. Transporters that are members of the Ca(2+)/cation antiporter (CaCA) superfamily are involved in the transport of Ca(2+) and/or other cations using the counter exchange of another ion such as H(+) or Na(+). The CaCA superfamily has been previously divided into five transporter families: the YRBG, Na(+)/Ca(2+) exchanger (NCX), Na(+)/Ca(2+), K(+) exchanger (NCKX), H(+)/cation exchanger (CAX), and cation/Ca(2+) exchanger (CCX) families, which include the well-characterized NCX and CAX transporters. To examine the evolution of CaCA transporters within higher plants and the green plant lineage, CaCA genes were identified from the genomes of sequenced flowering plants, a bryophyte, lycophyte, and freshwater and marine algae, and compared with those from non-plant species. We found evidence of the expansion and increased diversity of flowering plant genes within the CAX and CCX families. Genes related to the NCX family are present in land plant though they encode distinct MHX homologs which probably have an altered transport function. In contrast, the NCX and NCKX genes which are absent in land plants have been retained in many species of algae, especially the marine algae, indicating that these organisms may share "animal-like" characteristics of Ca(2+) homeostasis and signaling. A group of genes encoding novel CAX-like proteins containing an EF-hand domain were identified from plants and selected algae but appeared to be lacking in any other species. Lack of functional data for most of the CaCA proteins make it impossible to reliably predict substrate specificity and function for many of the groups or individual proteins. The abundance and diversity of CaCA genes throughout all branches of life indicates the importance of this class of cation transporter, and that many transporters with novel functions are waiting to be discovered.

Keywords: CaCA; H+/Ca2+ exchanger; Na+/Ca2+ exchanger; calcium transport; cation transport; evolution; phylogeny.


Figures

Figure 1
Figure 1
Topological model of the Na+/Ca2+ exchanger (NCX) protein. Barrel structures denote the transmembrane spanning domains identified by hydropathy analysis using TMHMM version 2. The conserved α1- and α2-repeat regions which span TM 2 and 3, and TM 7 and 8 are highlighted. The Ca2+-binding domains (CBD) and the predicted Na+ regulatory domain (NRD) present on the large central cytosolic loop are highlighted.
Figure 2
Figure 2
Variation in the distribution of genes within each of the major CaCA gene families (YRBG, NCX, NCKX, CCX, CHAA, CAX) and sub-families (MHX, EF–CAX) across eukaryotic and prokaryotic organisms. Gene numbers determined by phylogenetic analysis from representative species for each of the classes of organisms examined are shown. The species from which CaCA genes were identified are listed (left hand side) with the species name abbreviation in parentheses. The evolutionary relationships of the species is shown, generated using iTOL (http://itol.embl.de) and based on the NCBI taxonomy tree. For the full gene distribution for each of the species analyzed see Table S1 in Supplementary Material.
Figure 3
Figure 3
A phylogenetic tree of the CaCA superfamily. The tree was constructed using the maximum likelihood method and derived from alignments of conserved hydrophobic region sequences identified from the genomes of selected animal, fungal, land plant, algae, protist, bacterial, and archaebacterial species, listed in Figure 2. Six major groups are highlighted. The sub-groups determined for the CAX, CCX, NCX, and NCKX families as shown in Figures 4, 6, 7, and 9, are also given. Line colors and symbols denote the species class. Bootstrap values are indicated at the nodes of major branches. The branch length scale bar indicates the evolutionary distance of two amino acid substitutions per site.
Figure 4
Figure 4
Na+/Ca2+ exchanger family phylogenetic tree. The tree was constructed using genes identified in the NCX group of the full CaCA tree (Figure 3). A separate NCX sub-group named MHX is highlighted which includes all the plant genes including Arabidopsis MHX. Branch labels include the species name abbreviation defined in Figure 2 and are colored according to the species class using the same color code as in Figure 3. Bootstrap values are indicated at the nodes of major branches. The branch length scale bar indicates the evolutionary distance of 0.3 amino acid substitutions per site. Genes that are highlighted with an asterisk encode transporters for which the ion specificity has been determined.
Figure 5
Figure 5
Sequence and structural variation of NCX and MHX homologs. (A) Multiple amino acid sequence alignments of the α1- and α2-repeat region sequence from selected plant MHX, human NCX, and algal NCX proteins. Alignments were performed using ClustalW. Amino acids that are identical or similar are shaded black or gray, respectively. Predicted hydrophobic regions and putative transmembrane spans are over-lined. The α-repeat regions and signature residues are boxed in yellow. The red line separates the MHX and NCX sequences. Asterisks indicate residues shown to be important for Na+/Ca2+ exchange activity in NCX1, with those in red being not conserved in the MHX sequences. (B) Topology models of AtMHX and HsNCX1 generated by TMHMM. Red areas indicate predicted TM spans.
Figure 6
Figure 6
Na+/Ca2+/K+ exchanger family phylogenetic tree. The tree was constructed using genes identified in the NCKX group of the full CaCA tree (Figure 3). Three NCKX sub-groups are highlighted. Branch labels include the species name abbreviation defined in Figure 2 and are colored according to the species class using the same color code as in Figure 3. Bootstrap values are indicated at the nodes of major branches. The branch length scale bar indicates the evolutionary distance of 0.5 amino acid substitutions per site. Genes that are highlighted with an asterisk encode transporters for which the ion specificity has been determined.
Figure 7
Figure 7
Cation/Ca2+ exchanger family phylogenetic tree. The tree was constructed using genes identified in the CCX group of the full CaCA tree (Figure 3). Three CCX sub-groups are highlighted. Branch labels include the species name abbreviation defined in Figure 2 and are colored according to the species class using the same color code as in Figure 3. Bootstrap values are indicated at the nodes of major branches. The branch length scale bar indicates the evolutionary distance of 0.7 amino acid substitutions per site. Genes that are highlighted with an asterisk encode transporters for which the ion specificity has been determined.
Figure 8
Figure 8
Sequence variation of CCX homologs. Multiple amino acid sequence alignments of the α1- and α2-repeat region sequence from selected plant, moss, algal, and human CCX proteins. Alignments were performed using ClustalW. Amino acids that are identical or similar are shaded black or gray, respectively. Predicted transmembrane spans are over-lined. The α-repeat regions and signature residues are boxed in yellow. The red lines separate the Group 1, 2, and 3 CCX sequences.
Figure 9
Figure 9
CAX family phylogenetic tree. (A) The tree was constructed using genes identified in the CAX group of the full CaCA tree (Figure 3). The Type 1A-H and Type 2 CAX sub-groups are highlighted and determined using the nomenclature described previously (Shigaki et al., 2006). Branch labels include the species name abbreviation defined in Figure 2 and are colored according to the species class using the same color code as in Figure 3. The individual gene labels for the Type 1A and 1B groups are replaced by circles and the gene name labels are given in the enlarged tree sections in (B,C). Bootstrap values are indicated at the nodes of major branches. The branch length scale bar indicates the evolutionary distance of 0.5 amino acid substitutions per site [0.1 amino acid substitutions per site in (B,C)]. Genes that are highlighted with an asterisk encode transporters for which the ion specificity has been determined.
Figure 10
Figure 10
Multiple sequence alignment of CAX and EF–CAX sequences. Full-length amino acid sequences of selected Arabidopsis, Physcomitrella, and Selaginella CAX and EF–CAX proteins were aligned. The alignment was performed using ClustalW. Amino acids that are identical or similar are shaded black/red or gray/pink, respectively. The α-repeat regions and signature residues are highlighted. Amino acids that are conserved in >90% of CaCA proteins (Cai and Lytton, 2004a) are highlighted (asterisk) within the α1- and α2-repeat regions.
Figure 11
Figure 11
Structural and phylogenetic comparisons of CAX and EF–CAX proteins. (A) Schematic representation of the topology structure of a typical CAX protein (Arabidopsis CAX1) and a representative EF–CAX protein (Arabidopsis EFCAX1). The black line denotes the protein from N-terminus to C-terminus, red bars denote the TM domains as predicted by TMHMM, and the numbers indicate the first and last amino acid residues. The locations of the α1- and α2-repeat regions are highlighted. The identified Pfam domains are indicated above the protein schematic. (B) CAX gene family phylogenetic tree including the EF–CAX genes. The tree was constructed using the maximum likelihood method and derived from alignments of α2-repeat region sequences extracted from genes identified in the CAX group of the full CaCA tree (Figure 3) and the EF–CAX genes as determined by Pfam analysis. The CAX sub-groups are highlighted in addition to the EF–CAX sub-group. Branch labels include the species name abbreviation defined in Figure 2 or are replaced by a circle and are colored according to the species class using the same color code as in Figure 3. The branch length scale bar indicates the evolutionary distance of 0.6 amino acid substitutions per site.

References

    1. Altschul S. F., Madden T. L., Schaffer A. A., Zhang J. H., Zhang Z., Miller W., Lipman D. J. (1997). Gapped BLAST and PSI-BLAST: a new generation of protein database search programs. Nucleic Acids Res. 25, 3389–3402 10.1093/nar/25.17.3389 - DOI - PMC - PubMed
    1. Blackford S., Rea P. A., Sanders D. (1990). Voltage sensitivity of H+/Ca2+ antiport in higher-plant tonoplast suggests a role in vacuolar calcium accumulation. J. Biol. Chem. 265, 9617–9620 - PubMed
    1. Blaustein M. P., Lederer W. J. (1999). Sodium/calcium exchange: its physiological implications. Physiol. Rev. 79, 763–854 - PubMed
    1. Bock K. W., Honys D., Ward J. M., Padmanaban S., Nawrocki E. P., Hirschi K. D., Twell D., Sze H. (2006). Integrating membrane transport with male gametophyte development and function through transcriptomics. Plant Physiol. 140, 1151–1168 10.1104/pp.105.074708 - DOI - PMC - PubMed
    1. Cagnac O., Aranda-Sicilia M. N., Leterrier M., Rodriguez-Rosales M.-P., Venema K. (2010). Vacuolar cation/H+ antiporters of Saccharomyces cerevisiae. J. Biol. Chem. 285, 33914–33922 10.1074/jbc.M110.116590 - DOI - PMC - PubMed