. 2011 Oct;1(2):110008.
doi: 10.1098/rsob.110008.

Combined high-resolution genotyping and geospatial analysis reveals modes of endemic urban typhoid fever transmission

Affiliations

Combined high-resolution genotyping and geospatial analysis reveals modes of endemic urban typhoid fever transmission

Stephen Baker et al. Open Biol. 2011 Oct.

Abstract

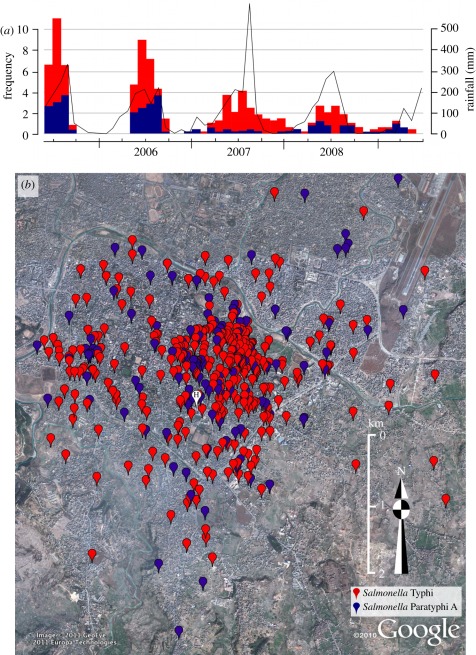
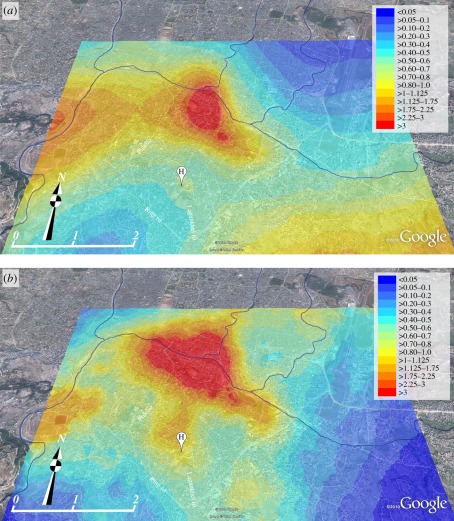
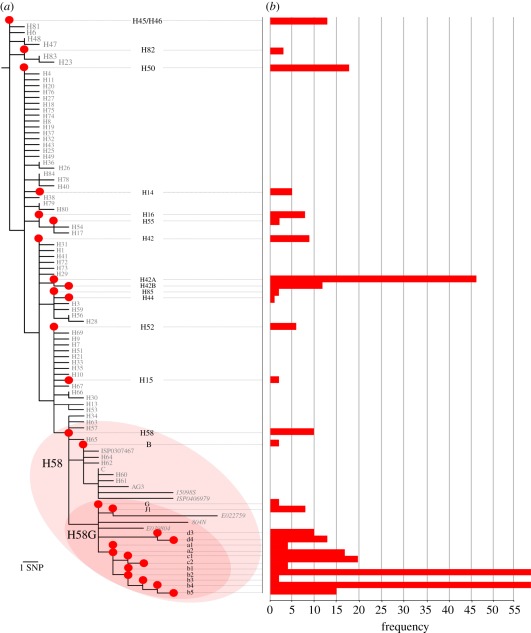
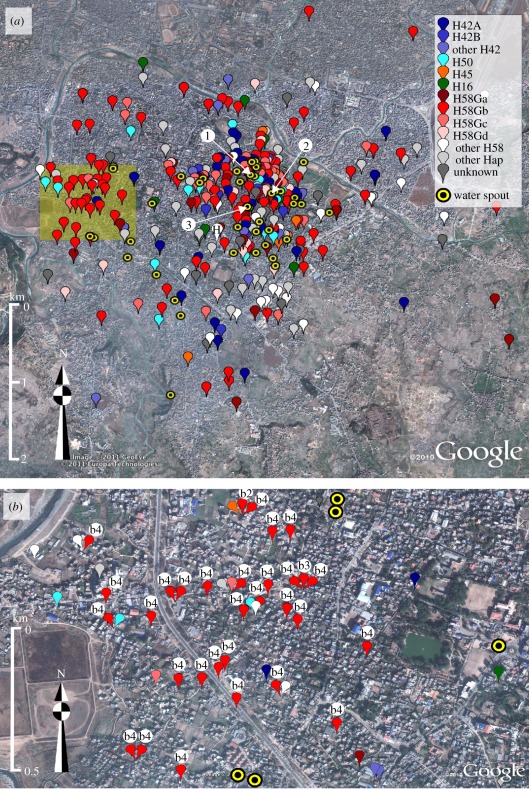
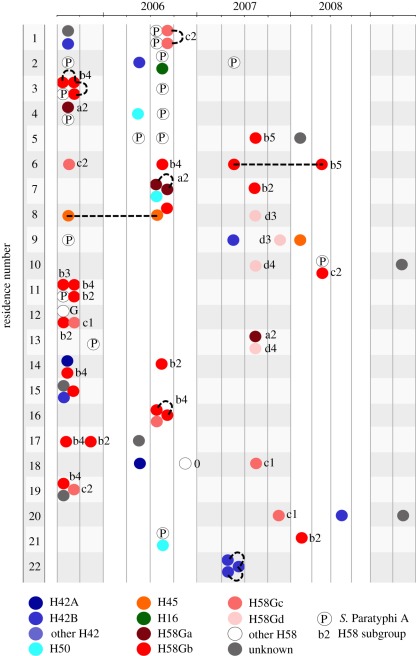
Typhoid is a systemic infection caused by Salmonella Typhi and Salmonella Paratyphi A, human-restricted bacteria that are transmitted faeco-orally. Salmonella Typhi and S. Paratyphi A are clonal, and their limited genetic diversity has precluded the identification of long-term transmission networks in areas with a high disease burden. To improve our understanding of typhoid transmission we have taken a novel approach, performing a longitudinal spatial case-control study for typhoid in Nepal, combining single-nucleotide polymorphism genotyping and case localization via global positioning. We show extensive clustering of typhoid occurring independent of population size and density. For the first time, we demonstrate an extensive range of genotypes existing within typhoid clusters, and even within individual households, including some resulting from clonal expansion. Furthermore, although the data provide evidence for direct human-to-human transmission, we demonstrate an overwhelming contribution of indirect transmission, potentially via contaminated water. Consistent with this, we detected S. Typhi and S. Paratyphi A in water supplies and found that typhoid was spatially associated with public water sources and low elevation. These findings have implications for typhoid-control strategies, and our innovative approach may be applied to other diseases caused by other monophyletic or emerging pathogens.

Keywords: Salmonella, typhoid, Paratyphoid, genotyping, transmission, geospatial.


Figures

Figure 1.
Figure 1.
The temporal and spatial distribution of typhoid infections. (a) Histogram showing the monthly temporal distribution of S. Typhi (red) and S. Paratyphi A (blue), and the corresponding monthly rainfall over the 4-year study period. (b) Google Earth map, of the study site showing locations of the residences of 584 culture-confirmed typhoid patients: 431 S. Typhi (red) and 153 S. Paratyphi A (blue). The site of patient enrolment (Patan Hospital) is marked H.
Figure 2.
Figure 2.
The variable spatial risk of typhoid infections. Elevated Google Earth map of the study terrain with heat map overlays showing the predicted spatial odds for (a) S. Typhi and (b) S. Paratyphi A infections compared with controls, as calculated by spatial risk modelling. Spatial odds for typhoid infections are scaled from low (blue) to high (red) as shown by the key. The site of patient enrolment is marked H; the lower-left scale represents distance in kilometres and the route of the Bagmati River is highlighted (flow: west to east).
Figure 3.
Figure 3.
Phylogenetic tree and frequencies of S. Typhi genotypes. (a) Phylogenetic tree showing the haplotype distribution of 387 S. Typhi strains isolated in the study area between June 2005 and May 2009. Red circles and black text indicate genotypes that were detected among the study isolates; grey text indicates genotypes that were defined by assayed loci, but not detected among the study isolates (i.e. would have been detected if present). The H58 and H58G clonal groups are highlighted. (b) Horizontal bar plot indicating the frequency of isolation of each S. Typhi genotype over the 4-year study period, according to the scale denoted on the x-axis.
Figure 4.
Figure 4.
The spatial distribution of S. Typhi genotypes. Google Earth maps of the study site showing locations of the residences of culture-confirmed S. Typhi infections, categorized by S. Typhi genotype (defined in figure 3) and the 42 functional water spouts including the three water-sampling sites (labelled 1, 2 and 3), according to the legend provided. (a) All 431 culture-confirmed S. Typhi infections from the 4-year study period. The site of patient enrolment is marked H. (b) Culture-confirmed S. Typhi infections occurring in a concentrated 1 km2 cluster to the west of the hospital (shaded as in (a)). The subgroups of the H58Gb are shown by the lower-case letters and numerals associated with red markers.
Figure 5.
Figure 5.
Intra-residence typhoid infections. Illustration depicts the 22 residences (vertical axis) with three or more culture-confirmed typhoid infections over the period of investigation (horizontal axis). Each individual infection is shown by coloured circles, which are grouped into three-month periods. Colours indicate the Salmonella serotype (the letter P indicates an S. Paratyphi A infection) or S. Typhi genotype associated with each infection, according to the legend provided (as defined in figure 3). Lower-case letters and numerals associated with red circles refer to the individual H58G subgroup (defined in figure 3). Broken black lines link isolates of the same genotype within a single residence.

References

    1. Basnyat B. 2005. Typhoid and paratyphoid fever. Lancet 366, 1603.10.1016/S0140-6736(05)67652-0 (doi:10.1016/S0140-6736(05)67652-0) - DOI - DOI - PubMed
    1. Parry CM, Hien TT, Dougan G, White NJ, Farrar JJ. 2002. Typhoid fever. N. Engl. J. Med. 347, 1770–178210.1056/NEJMra020201 (doi:10.1056/NEJMra020201) - DOI - DOI - PubMed
    1. Crump JA, Luby SP, Mintz ED. 2004. The global burden of typhoid fever. Bull. World Health Organ. 82, 346–353 - PMC - PubMed
    1. Basnyat B, Maskey AP, Zimmerman MD, Murdoch DR. 2005. Enteric (typhoid) fever in travelers. Clin. Infect. Dis. 41, 1467–147210.1086/497136 (doi:10.1086/497136) - DOI - DOI - PubMed
    1. Ledingham J. C. G. 1912. The carrier problem in infectious diseases. London, UK: Edward Arnold

Publication types

MeSH terms

LinkOut - more resources