. 2012 May 30:13:114.
doi: 10.1186/1471-2105-13-114.

Detection and correction of probe-level artefacts on microarrays

Affiliations

Detection and correction of probe-level artefacts on microarrays

Tobias Petri et al. BMC Bioinformatics. .

Abstract

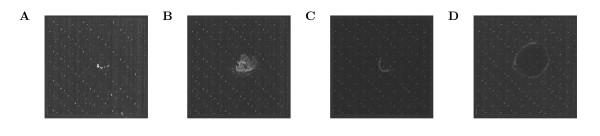
Background: A recent large-scale analysis of Gene Expression Omnibus (GEO) data found frequent evidence for spatial defects in a substantial fraction of Affymetrix microarrays in the GEO. Nevertheless, in contrast to quality assessment, artefact detection is not widely used in standard gene expression analysis pipelines. Furthermore, although approaches have been proposed to detect diverse types of spatial noise on arrays, the correction of these artefacts is mostly left to either summarization methods or the corresponding arrays are completely discarded.

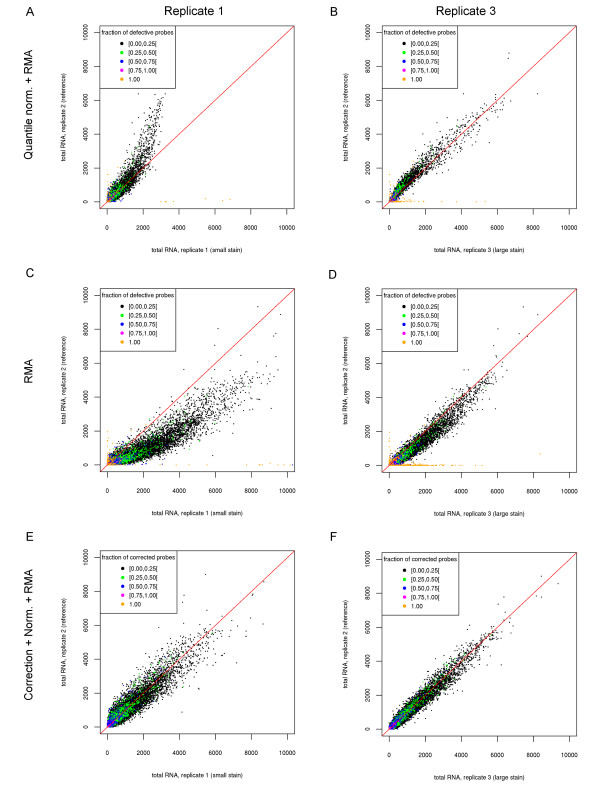
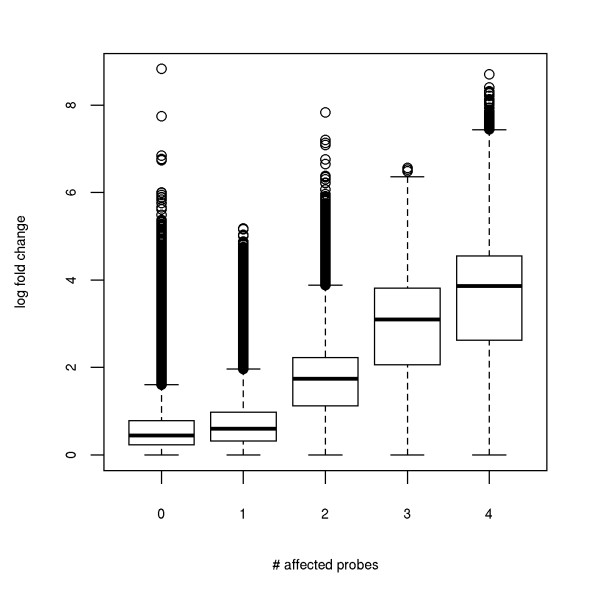
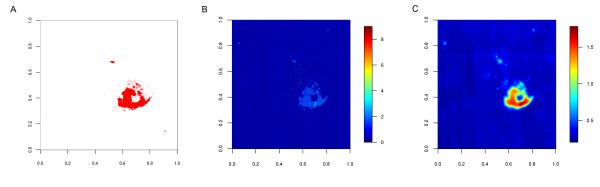
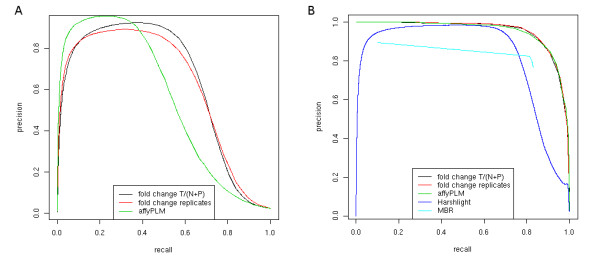
Results: We show that state-of-the-art robust summarization procedures are vulnerable to artefacts on arrays and cannot appropriately correct for these. To address this problem, we present a simple approach to detect artefacts with high recall and precision, which we further improve by taking into account the spatial layout of arrays. Finally, we propose two correction methods for these artefacts that either substitute values of defective probes using probeset information or filter corrupted probes. We show that our approach can identify and correct defective probe measurements appropriately and outperforms existing tools.

Conclusions: While summarization is insufficient to correct for defective probes, this problem can be addressed in a straightforward way by the methods we present for identification and correction of defective probes. As these methods output CEL files with corrected probe values that serve as input to standard normalization and summarization procedures, they can be easily integrated into existing microarray analysis pipelines as an additional pre-processing step. An R package is freely available from http://www.bio.ifi.lmu.de/artefact-correction.


Figures

Figure 1
Figure 1
Measurement artefacts observed on different arrays of our dataset: total RNA for replicates 1 (a) and 3 (b) in DG75-10/12 cells; total RNA for replicate 2 (c) in DG75-eGFP cells; newly transcribed RNA for replicate 1 (d) in DG75-eGFP cells.
Figure 2
Figure 2
Replicate scatter plots comparing total RNA for replicates 1 (a, c, e) and 3 (b, d, f) against the artefact-free replicate 2 for the exon array measurement in DG75-10/12 cells. Subfigures a and b show the results using both RMA and quantile normalization, c and d using only RMA without quantile normalization and E and F after probe correction. Probesets are colored according to the percentage of their probes that are flagged as corrupted according to the ε-criterion based on the noise scores calculated using newly transcribed and pre-existing RNA as control. For replicate 1 there is a bias even for the uncorrupted probesets (a) that can be reduced by omitting quantile normalization (c). If probe correction is applied prior to normalization and summarization (e,f), this bias is removed. Here, the results are shown for the correction method which replaces the probe value by the mean of the unaffected probes in the same probe set. In this case, the intensity of probesets for which all probes are corrupted are set to zero. Results for the filtering approach in which affected probes are removed from the probeset definition are very similar.
Figure 3
Figure 3
Boxplot of the log2 fold changes for probesets with 0, 1, 2, 3 or 4 spiked probes in the simulation in which 5% of all probes were spiked in total (δ=0.05). Here, probesets with the same number of spiked probes were pooled across all simulation results. For the case of 0 spiked probes, probesets were selected randomly from the pooled set as there were too many probesets for loading into R. In this case, each probeset was selected with a probability of 0.01. We observe a very strong correlation between the number of affected probes and fold-change biases on probeset level, which may seriously harm downstream analyses.
Figure 4
Figure 4
Illustration of the results on the spiked Gene ST arrays. Both shape of the artefact and intensities of the spiked probes were transfered from exon arrays containing artefacts. a) shows the spiked probes in red and b) and c) the probe scores based on fold changes between replicates using only the probe information itself (b) or also its neighborhood (c). For both b and c the overall shape of the spiked stain can easily be identified, but only when using the window-criterion (c) all probes within this area are identified. Furthermore, in B there are more probes with high noise scores that were not spiked (false positives).
Figure 5
Figure 5
Precision-Recall curves for spiked Gene ST measurements. Here, artefacts were projected from the exon array measurements onto the gene arrays to produce realistic noise patterns. Three different scoring approaches were compared both for the simple threshold approach, the ε-criterion (a), and its cumulative variant, the window-criterion (b), which takes into account the probe neighborhood information. The scoring approaches compared are: (i) absolute log fold change between total RNA and normalized sum of newly transcribed and pre-existing RNA (fold change (T/N + P), see Methods); (ii) absolute log fold change between replicates (fold change replicates); (iii) residuals determined with the RMA summarization approach using the affyPLM model (affyPLM). These results show that the window-based approach improves the performance of all used methods, resulting in almost identical performance for all of them, which is superior to the performance of both Harshlight and MBR.

References

    1. Lockhart DJ, Dong H, Byrne MC, Follettie MT, Gallo MV, Chee MS, Mittmann M, Wang C, Kobayashi M, Horton H, Brown EL. Expression monitoring by hybridization to high-density oligonucleotide arrays. Nat Biotechnol. 1996;14(13):1675–1680. doi: 10.1038/nbt1296-1675. - DOI - PubMed
    1. Shalon D, Smith SJ, Brown PO. A DNA microarray system for analyzing complex DNA samples using two-color fluorescent probe hybridization. Genome Res. 1996;6(7):639–645. doi: 10.1101/gr.6.7.639. - DOI - PubMed
    1. Bertone P, Stolc V, Royce TE, Rozowsky JS, Urban AE, Zhu X, Rinn JL, Tongprasit W, Samanta M, Weissman S, Gerstein M, Snyder M. Global identification of human transcribed sequences with genome tiling arrays. Science. 2004;306(5705):2242–2246. doi: 10.1126/science.1103388. - DOI - PubMed
    1. Gardina PJ, Clark TA, Shimada B, Staples MK, Yang Q, Veitch J, Schweitzer A, Awad T, Sugnet C, Dee S, Davies C, Williams A, Turpaz Y. Alternative splicing and differential gene expression in colon cancer detected by a whole genome exon array. BMC Genomics. 2006;7:325. doi: 10.1186/1471-2164-7-325. - DOI - PMC - PubMed
    1. Wang Z, Gerstein M, Snyder M. RNA-Seq: a revolutionary tool for transcriptomics. Nat Rev Genet. 2009;10:57–63. doi: 10.1038/nrg2484. - DOI - PMC - PubMed

Publication types

MeSH terms